The Negative Control
This morning I published The Third Schedule, arguing from my own commit history — 9,806 commits across 183 repositories — that maker time is no longer singular. Three companion pieces followed it out into the world: The Robots Got There First checked the claim against robotics and cognitive science, the field survey checked it against everything practitioners and telemetry vendors have published, and Fan-Out: What the Literature Already Knew traced the lineage back through supervisory control to Graicunas in 1933. All four share a weakness they were honest about but could not fix: every measured number in them comes from one practitioner's git history. Mine.
The field survey ended with an invitation — open your own window, publish your distribution, three windows would make it a literature. This post is what happened when I opened every other window I could reach: ten more datasets, run through the same pipeline. Nine of them belong to practices I'm involved in. The tenth is the important one: the multi-year git history of a conventional, non-agentic full-stack developer, run through the identical analysis. A negative control — the thing every measurement in this series had been missing.
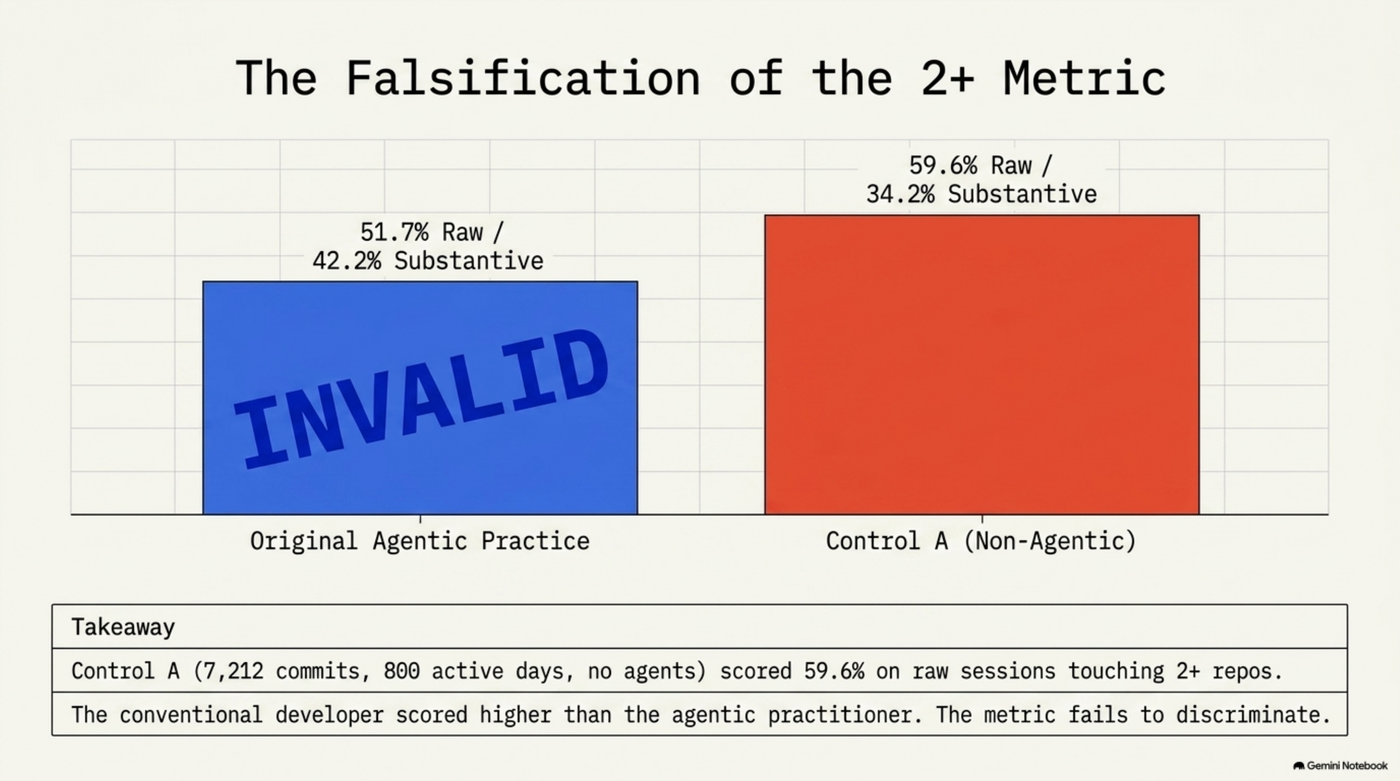
The control came back with a result I have to lead with, because it breaks the series' headline statistic. The original essay reported that 51.7% of my working sessions put commits into two or more repositories — 42.2% counting only substantive work — and treated that as the visible fingerprint of parallel builder time. The conventional developer's history shows 59.6% of sessions touching two or more repos. Higher than mine. No agents involved. The 2+-repo session, it turns out, is just what ordinary full-stack work on a multi-repo platform looks like, and the earlier posts should not have leaned on it. What survives the control is narrower, more specific, and — I'll argue — more interesting. But the correction comes first.
What a negative control is for
The four earlier posts stress-tested the claim in every way available from inside one dataset: complexity-scoring every commit, stripping scripted rollouts, halving the flashiest numbers, refusing the multiplier. What none of that can catch is the possibility that the metric itself doesn't discriminate — that ordinary, pre-agentic development would light up the same instrument. That's what a control group is for, and single-practitioner essays don't have one.
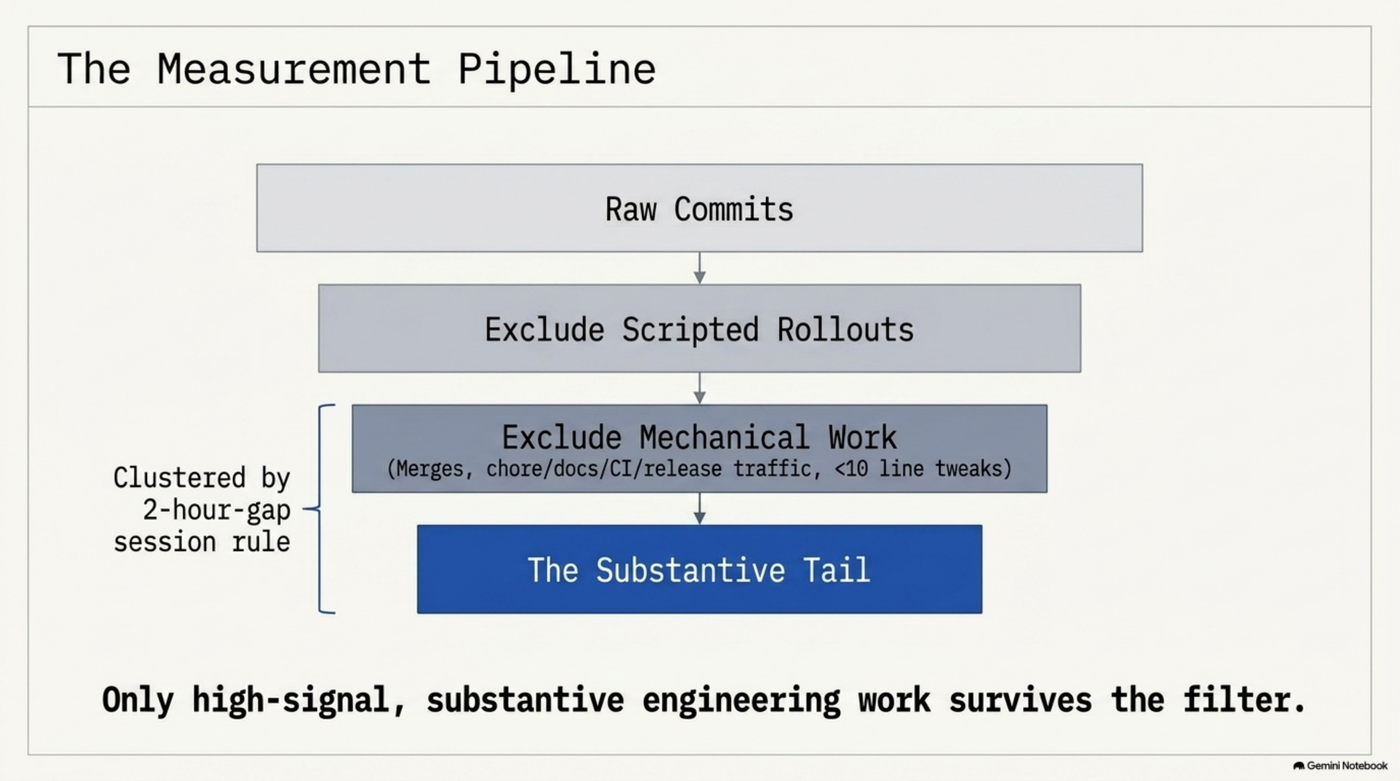
I got mine from a dataset I'll describe only in aggregate: a ten-year, seventeen-repository SaaS platform I have full local history for — 36,322 commits, 2016 through mid-2026, a normal multi-person team, essentially no agentic practice in the record. Within it, two individual developers with long, clean, single-author histories, extracted and run through exactly the pipeline the original essay used: two-hour-gap session clustering, scripted-fan-out exclusion, mechanical-versus-substantive stratification (merges, chore/docs/CI/release traffic, and sub-ten-line tweaks scored mechanical; the rest substantive).
Control A — the platform's most active contractor developer. 7,212 commits, 2022–2026, 800 active days of conventional full-stack work. Sessions touching 2+ repos: 59.6% raw, 34.2% substantive. Sessions touching 5+ repos: 0.0%. Raw or substantive — zero, in four years. The most repositories this developer ever touched in a single session was three. The busiest single day of a four-year career: 33 commits.
Control B — the platform's internal lead developer. 4,617 commits, 2022–2025. 2+ sessions: 48.1% raw, 31.6% substantive. 5+ sessions: 1.1% raw, 0.3% substantive. The busiest day in a decade of data: 69 commits across five repos — once.
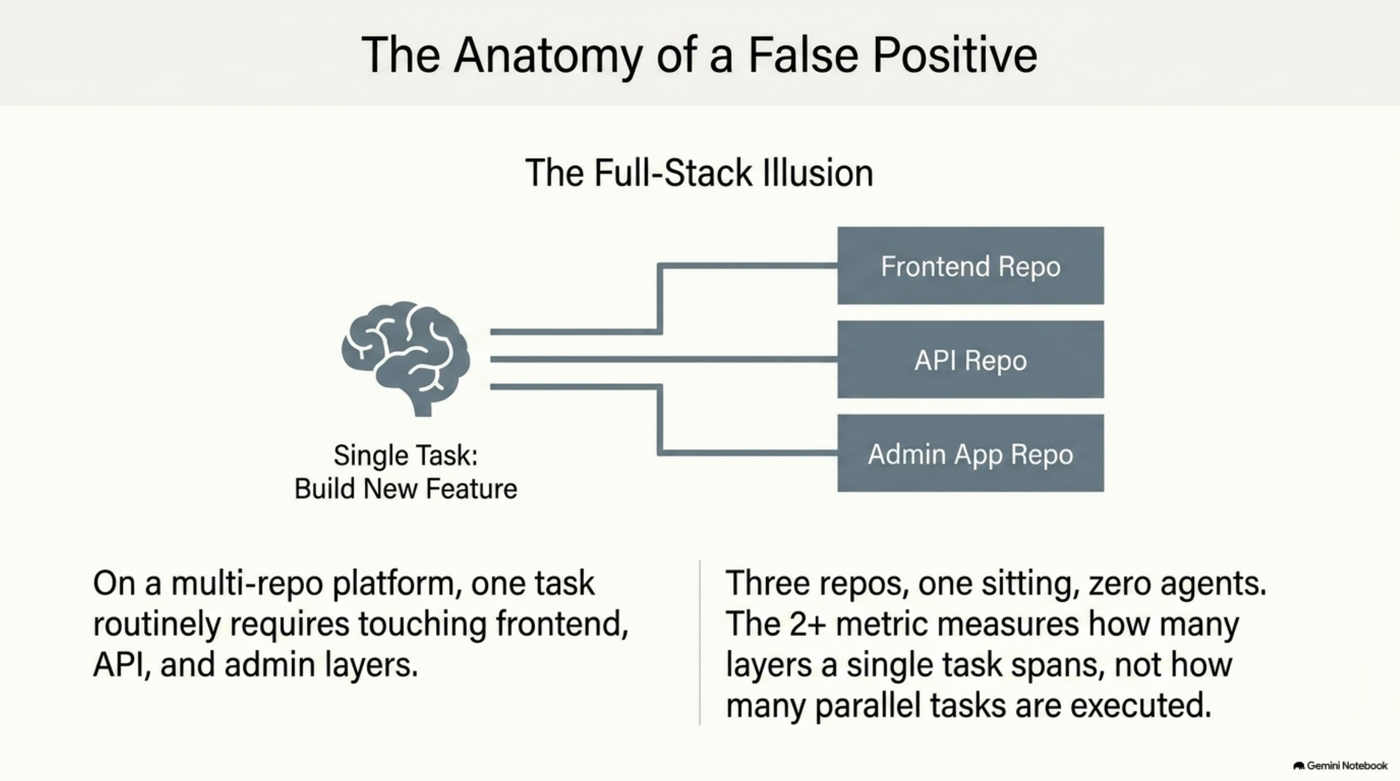
Read those against the original practice's numbers — 51.7% / 42.2% at 2+, and 11.7% / 5.2% at 5+ — and the verdict writes itself. On the 2+ metric, a conventional developer and an agentic practitioner are indistinguishable; on the raw version the conventional developer actually scores higher. The reason is mundane once you see it: on a multi-repo platform, "one task" routinely means frontend plus API plus admin app. Three repos, one sitting, no agents, no parallelism of judgment — just the ordinary shape of full-stack work. The original essay controlled for scripted breadth and mechanical commits, but it never controlled for this, because it had no conventional history to compare against.
Where the two practices separate — cleanly, and by more than an order of magnitude — is the wide tail. Five or more repositories receiving substantive work in one continuous session: 5.2% of my sessions; 0.0% and 0.3% for the two controls, across roughly 12,000 commits and 1,345 sessions of conventional work, on a platform with seventeen repos available to roam. The 2+ number measures how many repos a task spans. The 5+ substantive number measures how many tasks a session spans — and that is the quantity the whole series was actually about.
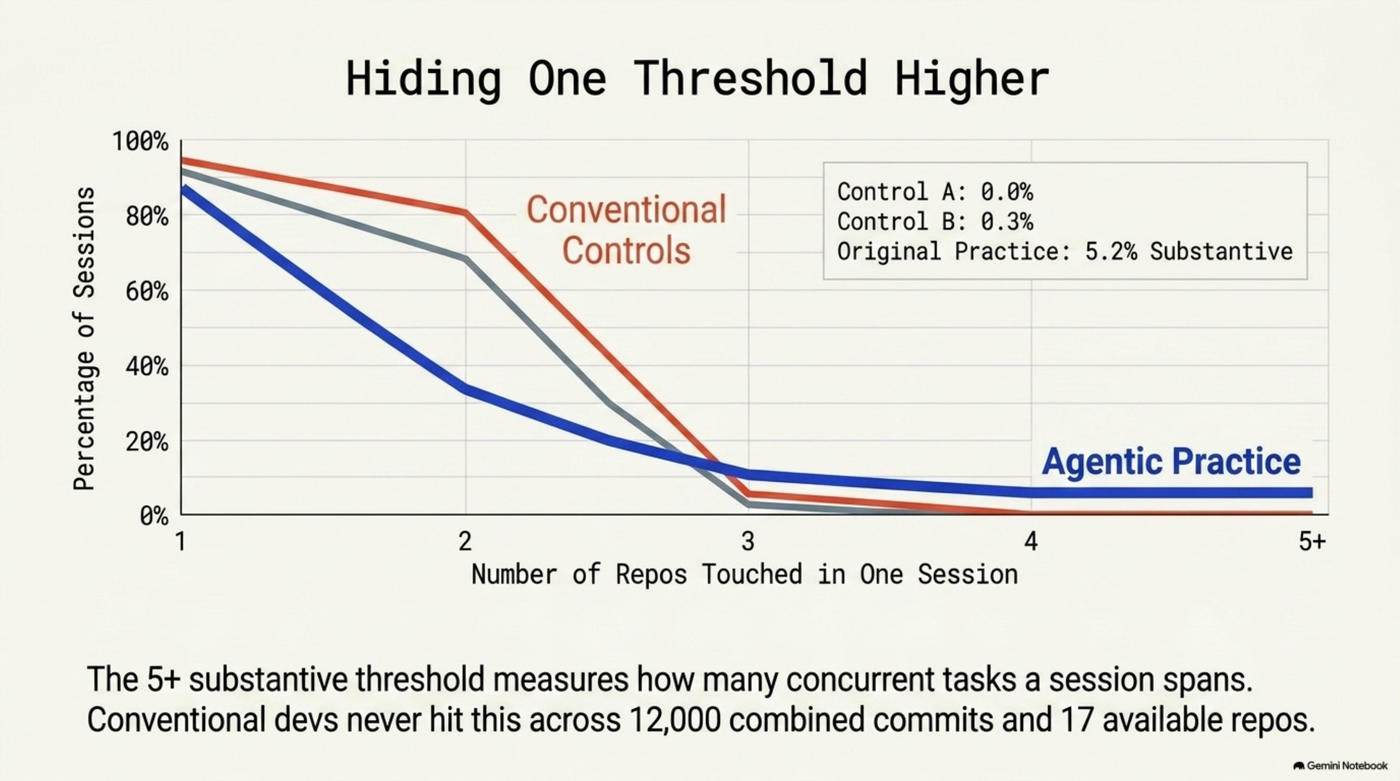
So, plainly: the earlier posts' "half of all sessions are multi-repo" framing is true but not distinctive, and I withdraw it as evidence. The distinctive claim was hiding one threshold higher the whole time.
Ten windows, honestly described
The control reframes the question for every other dataset: not "does it show multi-repo sessions?" but "does it show the wide substantive tail, or the things that tail turns into when repo boundaries aren't available?" Here is each source, with what it does and doesn't show. All numbers were pulled fresh from local checkouts today, using author timestamps; one caveat about that process appears in the flags section below, because it belongs in the text and not a footnote.
The KCP family — nine public repos, fully checkable. The KCP ecosystem is open source (Apache 2.0), so this is the one slice anyone can audit: 1,021 commits across nine repos, late February through mid-August 2026, 71 active days. 46.9% substantive after stratification. Session parallelism: 39.7% raw / 25.9% substantive at 2+, and 2.6% / 0.9% at 5+. Restricting to my own and my agents' identities (851 commits): 44.2% / 28.8% at 2+, 2.9% / 1.0% at 5+. Two honest readings. First, the 2+ figures land right in the same band as the conventional controls — consistent with the correction above, not with the original framing. Second, the 5+ figures are floor-compressed by construction: you cannot fan out across sixty repos inside a nine-repo family, so 0.9–1.0% here is a lower bound imposed by portfolio width, not evidence of less parallel practice. I note it rather than explain it away — but the compression is arithmetic, not interpretation. One replication did land cleanly: the family's largest session — 71 commits across seven repos in 15.1 hours — began on July 14, the same day the original essay's scripted-rollout lesson came from, and the same fan-out filter caught part of it here too. The caution generalizes even where the headline doesn't.
Sunstone Atlas — the substantive-ratio outlier. The Sunstone Atlas repo: 139 commits on main over a month, 17–18 active days. Single repo, so the cross-repo metric doesn't apply. What it contributes instead: 84.2% of commits score substantive — the highest of any source in either analysis, against 31–47% for the CI-diluted and legacy repos below — and an absorption density of roughly 4.4 merged PRs per active working day. And one thing it refuses to contribute: I have previously described this project as landing 100+ commits within hours. That is not reproducible from the main branch as it exists. The likely explanation is squash-merging — 139 main commits against PR numbers running to #144 means one commit ≈ one absorbed PR, hiding the underlying agent commit volume — but "likely explanation" is not a measurement, so the description is withdrawn until it can be re-derived.
lib-pcb — the contrast case, included because it doesn't fit. The PCB library sprint has featured on this wiki repeatedly, so it has to face the same audit. Its shape is confirmed: 626 commits, of which 620 landed in Q1 2026 — one intense focused sprint, then near-silence, exactly as documented. But it is architecturally not an instance of the third-schedule pattern: single repo, single burst, only 31.2% substantive after stratification (a CI account and release traffic carry much of the volume). It stays in this survey as the honest contrast — concentrated burst, not sustained portfolio parallelism — and I won't force it into the pattern's shape. One more flag: the "197,831 lines" figure attached to it in earlier writing is not reproducible from git data by any obvious cut (current tracked lines, source-only lines, and cumulative insertions all land elsewhere); it was probably a code-line count from a snapshot tool at the time, and it should not be reused until re-derived.
Synthesis — measured, but narrow. 670 commits over five months, 44 active days, 42.8% substantive (release automation dilutes it), busiest day 54 commits, longest session 48 commits over 15.5 hours. Single repo; parallelism metric not applicable. I had hoped to add live usage telemetry from the tooling itself, and mostly couldn't: the CLI wasn't runnable from the analysis environment, and the one metrics endpoint that did respond covered a single tool's traffic. What that endpoint legitimately supports is one narrow sentence — the tooling runs at five-digit weekly invocation volume across 100+ registered workspaces — and nothing more, so nothing more is claimed.
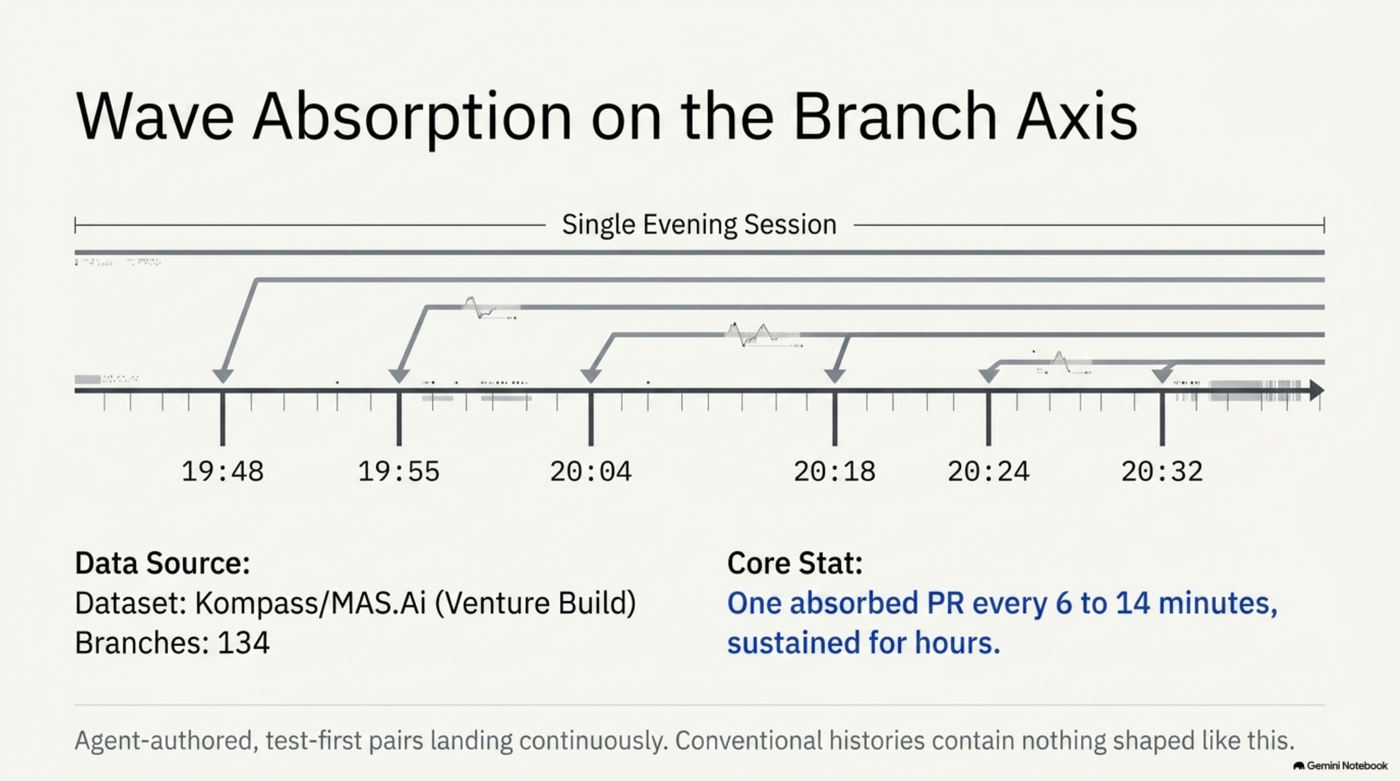
Kompass/MAS.Ai — where fan-out changes axis. A venture build whose design is prototyped by an external partner (whom I'm deliberately not identifying) and absorbed into a production repo. This is the strongest evidence in the whole set for what the pattern looks like when repo boundaries aren't available: 291 commits in just 14 active days, across 134 branches, 75.3% substantive, with direct agent authorship visible in the log (71 commits authored by Claude, merged by me). The wave shape is confirmed from commit subjects, not taken on trust: agent-authored test-first pairs ("add failing tests for X" → "implement X") landing continuously; on the densest evening, six consecutive PRs merged at 19:48, 19:55, 20:04, 20:18, 20:24, 20:32 — one absorbed PR every 6–14 minutes, for hours; five engine modules built on parallel branches and merged consecutively through a dedicated integration branch, dependency-ordered. Largest session: 112 commits in 9.3 hours. Busiest day: 96 commits. This is the multi-repo fan-out of the original essay transposed onto the branch/PR axis — parallel branches as the unit of fan-out, wave absorption as the cadence. One claim about this project I've seen in my own notes — "over a thousand tests" — is not verified by the git record, which attests only 78-passing plus a couple dozen test-adding commits, and I won't repeat the larger number without a test-runner count.
A client engagement, too thin to use. One anonymized client repo: 112 commits, three weeks, two contributors. I ran the pipeline; the result supports and refutes nothing about parallelism at that sample size, so this source is reported for completeness and cited for no conclusion. Datasets you decline to use belong in the record too — that's most of what makes the ones you do use believable.
The ten-year platform, at team level. The same seventeen-repo platform the controls came from, taken whole: 4,937 team sessions across a decade show 52.5% raw / 40.0% substantive at 2+, and 4.6% / 2.5% at 5+. Numbers superficially close to the original practice's — and meaning something entirely different, because the session-clustering method assumes a single practitioner, and these "sessions" conflate five to ten concurrent humans. That realization is what forced the single-author controls in the first place; the team-level figures are reported here only as the cautionary artifact they are. If your parallelism metric can't tell one agentic practitioner from half a team of ordinary ones, it isn't finished.
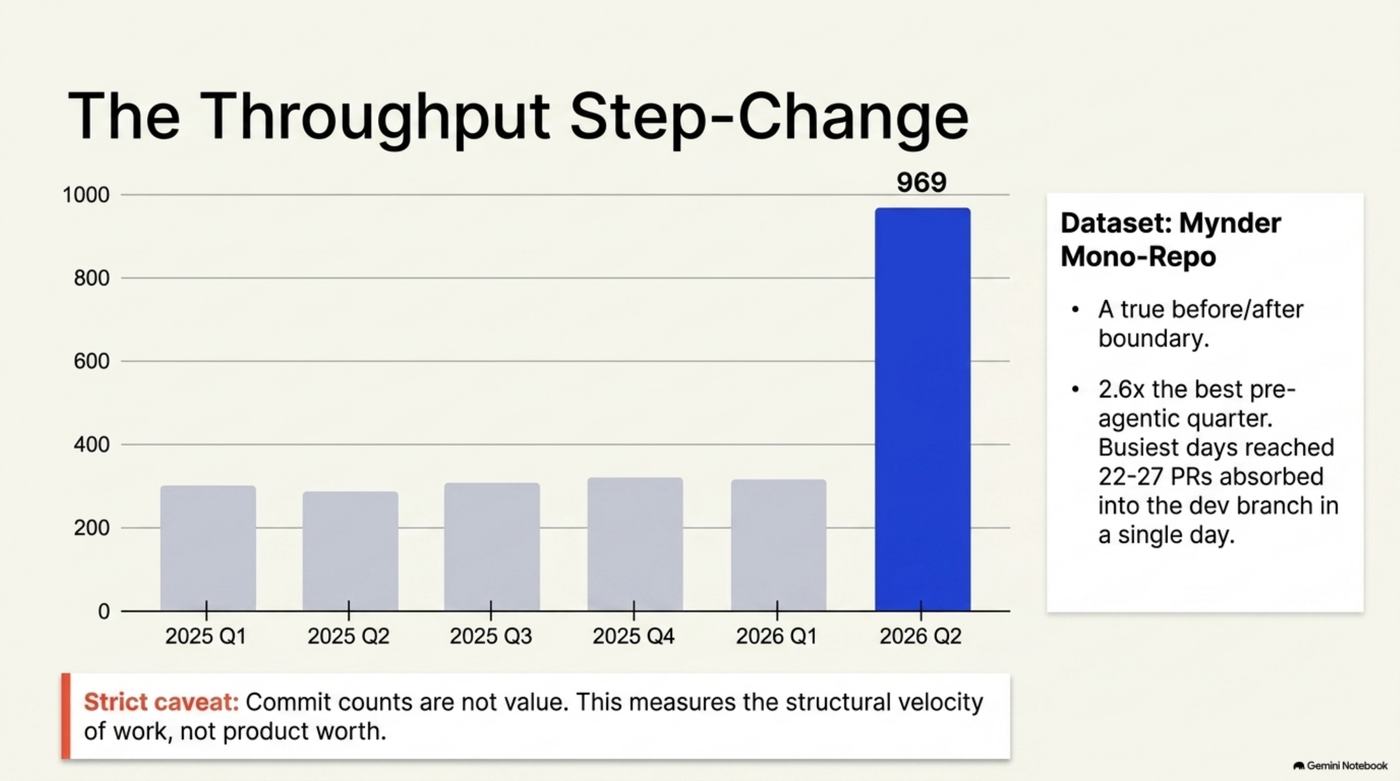
Mynder — the before/after a client's mono-repo provides. I serve as interim CTO at Mynder, arriving mid-March 2026 with an agentic practice; the team's mono-repo history reaches back to January 2025, which makes it the closest thing in this set to a before/after design. Individuals stay unnamed; groups only. Pre-agentic baseline, all of 2025: 200–400 commits per quarter, whole team. 2026 Q2: 969 commits — 2.6× the best pre-agentic quarter — of which 700 are mine. Q3 to date continues the ratio. On the absorption side, the busiest days run 22–27 PRs merged to the dev branch in a single day, all in the agentic period — the mono-repo equivalent of the fan-out tail, again on the branch/PR axis. And the caveats are load-bearing, so they go here and not in fine print: commit counts are not value; the repo squash-merges, so one commit ≈ one PR (which if anything understates the agentic period); attribution is by merge author; and this is a live team's shared repo across a role change and a roadmap shift, not a controlled experiment. What the data supports is exactly one sentence: a throughput step-change coincides with the arrival of the agentic practice, at roughly 2.6× the prior best quarter, visible in absorption cadence as well as volume. What it cannot support is any claim about what that throughput was worth — that judgment belongs to the team and the product, not the git log.
The scorecard
| Source | Repos | Commits | Substantive | 2+ (raw/subst) | 5+ (raw/subst) | What it's evidence of |
|---|---|---|---|---|---|---|
| Original practice (reference) | 183 | 9,806 | — | 51.7% / 42.2% | 11.7% / 5.2% | the claim under test |
| Conventional dev, control A | 17 avail. | 7,212 | 38.4% | 59.6% / 34.2% | 0.0% / 0.0% | 2+ is ordinary; 5+ never happens |
| Conventional dev, control B | 17 avail. | 4,617 | 46.5% | 48.1% / 31.6% | 1.1% / 0.3% | same, second sample |
| KCP family (public) | 9 | 1,021 | 46.9% | 39.7% / 25.9% | 2.6% / 0.9%* | July-14 caution replicates; *floor-compressed |
| Sunstone Atlas | 1 | 139 | 84.2% | n/a | n/a | substantive ratio + PR absorption |
| lib-pcb | 1 | 626 | 31.2% | n/a | n/a | contrast case: burst, not parallelism |
| Synthesis | 1 | 670 | 42.8% | n/a | n/a | single-repo cadence only |
| Kompass/MAS.Ai | 1 (134 branches) | 291 | 75.3% | n/a | n/a | wave absorption: PR every 6–14 min |
| Client repo (anon) | 1 | 112 | 73.2% | n/a | n/a | too thin — cited for nothing |
| Platform, whole team (anon) | 17 | 36,322 | 45.4% | 52.5% / 40.0% | 4.6% / 2.5% | conflates humans — methodological warning |
| Mynder mono-repo | 1 | 2,996 | 68.2% | n/a | n/a | throughput step-change, 2.6× |
What actually survives
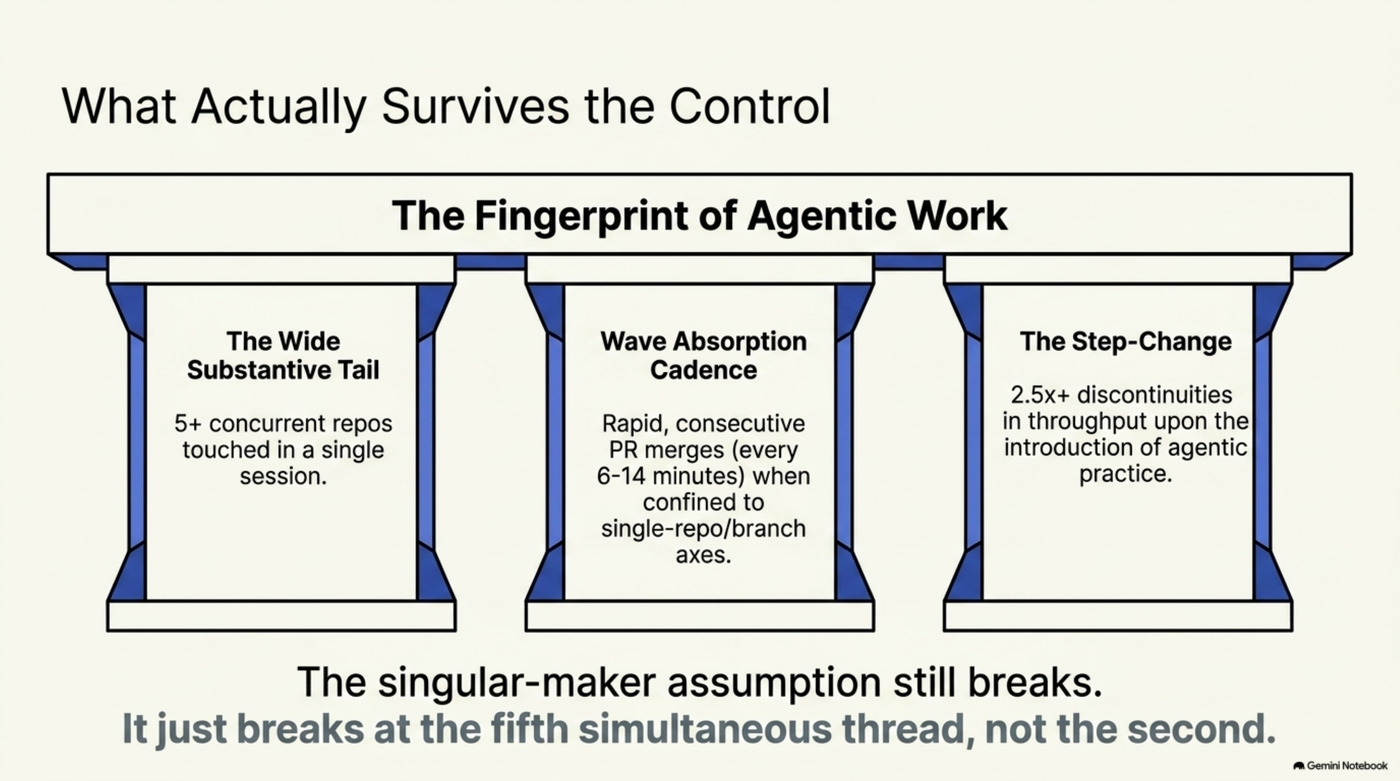
Strip away the metric the control killed, and three findings hold across every dataset where they're expressible:
1. The wide substantive tail. Sessions carrying substantive work in five or more repositories: 5.2% of the original practice; 0.0% and 0.3% for two conventional developers with 17 repos available and roughly 12,000 commits between them. That separation — seventeen-fold at minimum, unbounded at the median — survives the mechanical/substantive audit, survives the negative control, and is the defensible fingerprint of parallel builder time in git metadata. Its one honest dependency: it needs portfolio width to express. Confine the same practice to nine repos and it compresses toward the floor; confine it to one and it vanishes from this metric entirely — which is why the next finding matters.
2. Wave absorption, wherever repo boundaries don't exist. In single-repo settings the same practice shows up on the branch/PR axis instead: a PR absorbed every 6–14 minutes for hours and five modules merged consecutively off parallel branches at the venture; 22–27 PRs absorbed into dev in single days at Mynder; ~4.4 PRs per active day at Sunstone Atlas. The conventional histories contain nothing shaped like this. Fan-out is the practice; repos versus branches is just where the seams happen to fall. The robotics literature the second post leaned on would call this the same supervisory-control loop under a different partitioning of the fleet.
3. The throughput step-change, with its caveats attached. One environment in this set has a genuine before/after boundary, and it shows 2.6× the best pre-agentic quarter, sustained across two quarters, with the absorption cadence shifting in the same period. Confounded, single-site, counted in commits — all conceded above — but it is the only source here that measures the arrival of the practice into an existing team rather than the practice measuring itself, and the discontinuity is not subtle.
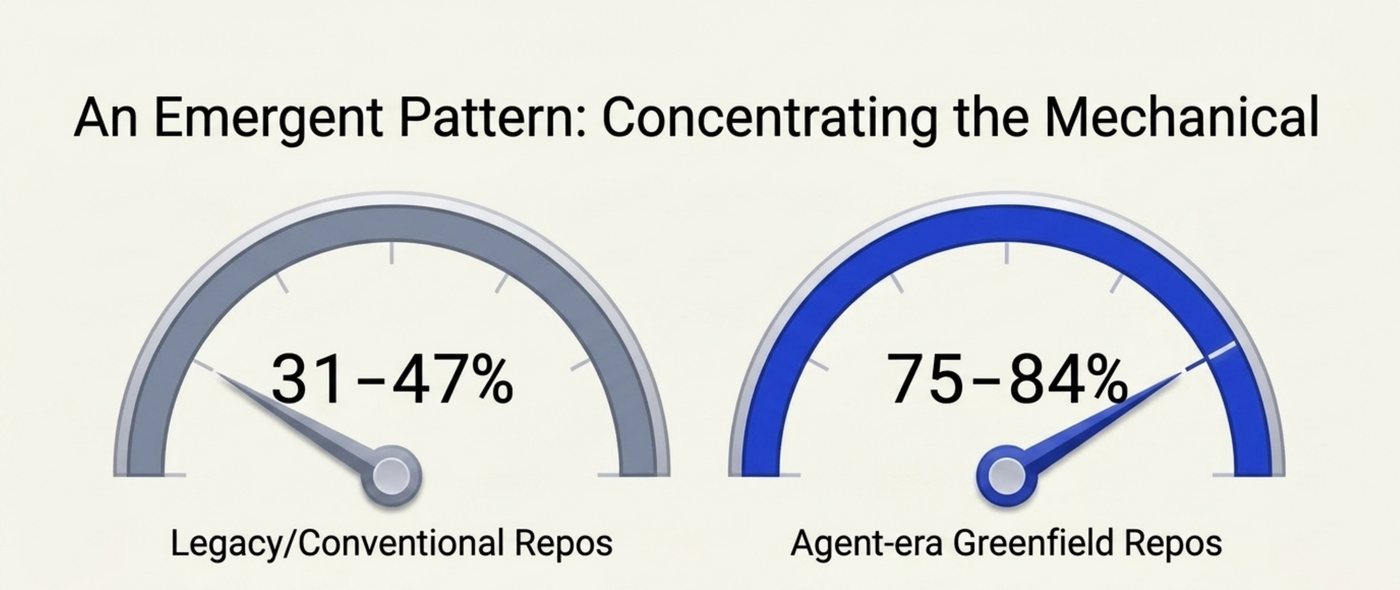
There's a fourth pattern I'll flag at lower confidence because it wasn't a preregistered question: the agent-era greenfield repos run 75–84% substantive commits, against 31–47% for the legacy platform and the CI-diluted repos. If it holds up elsewhere, it suggests the practice concentrates mechanical traffic into machinery and out of the authored stream — but two repos is a hint, not a finding.
The flags I owe you
The series' rule is that the audit appears in the text, so: everything above comes from local git checkouts, author timestamps, and a scripted pipeline — and that pipeline had a bug during this analysis. The first pass silently dropped ISO timestamps ending in Z, which is the format server-side merge commits arrive in — CI merges, hosted-platform squash merges — so every repo with hosted merging was initially undercounted. It was caught mid-analysis and every number above is post-fix; I mention it because a bug you catch and disclose is method, and a bug you catch and don't is luck. Beyond that: author dates can be shifted by rebases; several checkouts cannot be refreshed from here, so freshness is as-stated per source; three previously-published figures (lib-pcb's line count, Sunstone's burst description, the venture's test count) are explicitly withdrawn-pending-rederivation above rather than repeated; and the client datasets carry confounders — role changes, roadmap phases, team composition — that no amount of commit-counting controls for. Finally, the deepest limit hasn't moved since the first post: timestamps measure the structure of work, not its quality or authorship, and nothing in this piece claims otherwise.
Where this leaves the series
The field survey closed by saying that session-level parallelism measurement was missing from the public record, and invited others to publish theirs. I've now done the nearest available version of that myself, and the result is the one a fair test is supposed to produce: part of the claim failed. The 2+-repo statistic that the original essay reported as its headline, and that two companions repeated as the fingerprint of the pattern, does not distinguish agentic practice from ordinary full-stack work — a conventional developer beat my raw number without ever running an agent. If you quote this series, don't quote that number.
Quote what survived its own control: a wide-substantive-fan-out tail that conventional practice never produces, a wave-absorption cadence that shows up on whatever axis the repo topology allows, and one measured step-change where the practice arrived into a team that had a baseline. Smaller claims than the series started with. Better ones — because the singular-maker assumption still breaks in every dataset where an agentic practitioner appears; it just breaks at the fifth simultaneous thread, not the second. And the revised invitation stands, sharpened: don't publish your 2+ percentage — mine was never evidence, and yours won't be either. Publish your substantive 5+ tail, your absorption cadence — and run a control. It's the only number in this series that needed one to mean anything, and it's the only part of the method I'd now call non-optional.
Co-authored with Claude, which ran the measurement pipeline and drafted the piece; the practice, the datasets, and the corrections are Totto's. This closes the third-schedule series: The Third Schedule made the claim, The Robots Got There First and the field survey took it to the literature and the field, Fan-Out traced its lineage — and this post gave it the control group it was missing. Client engagements and the venture's design partner are anonymized throughout; the KCP-family numbers are the ones you can check yourself.
Series: The Third Schedule
← Fan-Out: What the Literature Already Knew About the Third Schedule · Part 5 of 5