What a 10× Workday Actually Looks Like
A realistic Tuesday with real output numbers, eight tasks, and the parts nobody talks about.
This is Part 2 of three. Part 1 covers the architecture. Part 3 is written by the model running inside it.
Most writing about AI-assisted development describes the architecture. This is about the texture — what a day actually feels like when you have spent months building an integrated development environment and the tools have had time to accumulate context about your work.
Before the Tuesday, the aggregate. Here is what the past 30 days of development looks like across six active repositories:
| Repo | Commits | Unique files touched | Lines changed |
|---|---|---|---|
| Synthesis | 413 | 1,045 | ~230,000 |
| lib-pcb | 128 | 363 | ~95,000 |
| lib-pcb-app | 124 | 606 | ~466,000 |
| KCP | 51 | 57 | ~14,000 |
| Wiki / docs | 107 | 397 | ~151,000 |
| Industrial connector service | 24 | 68 | ~2,800 |
| Total | 847 | 2,536 | ~959,000 |
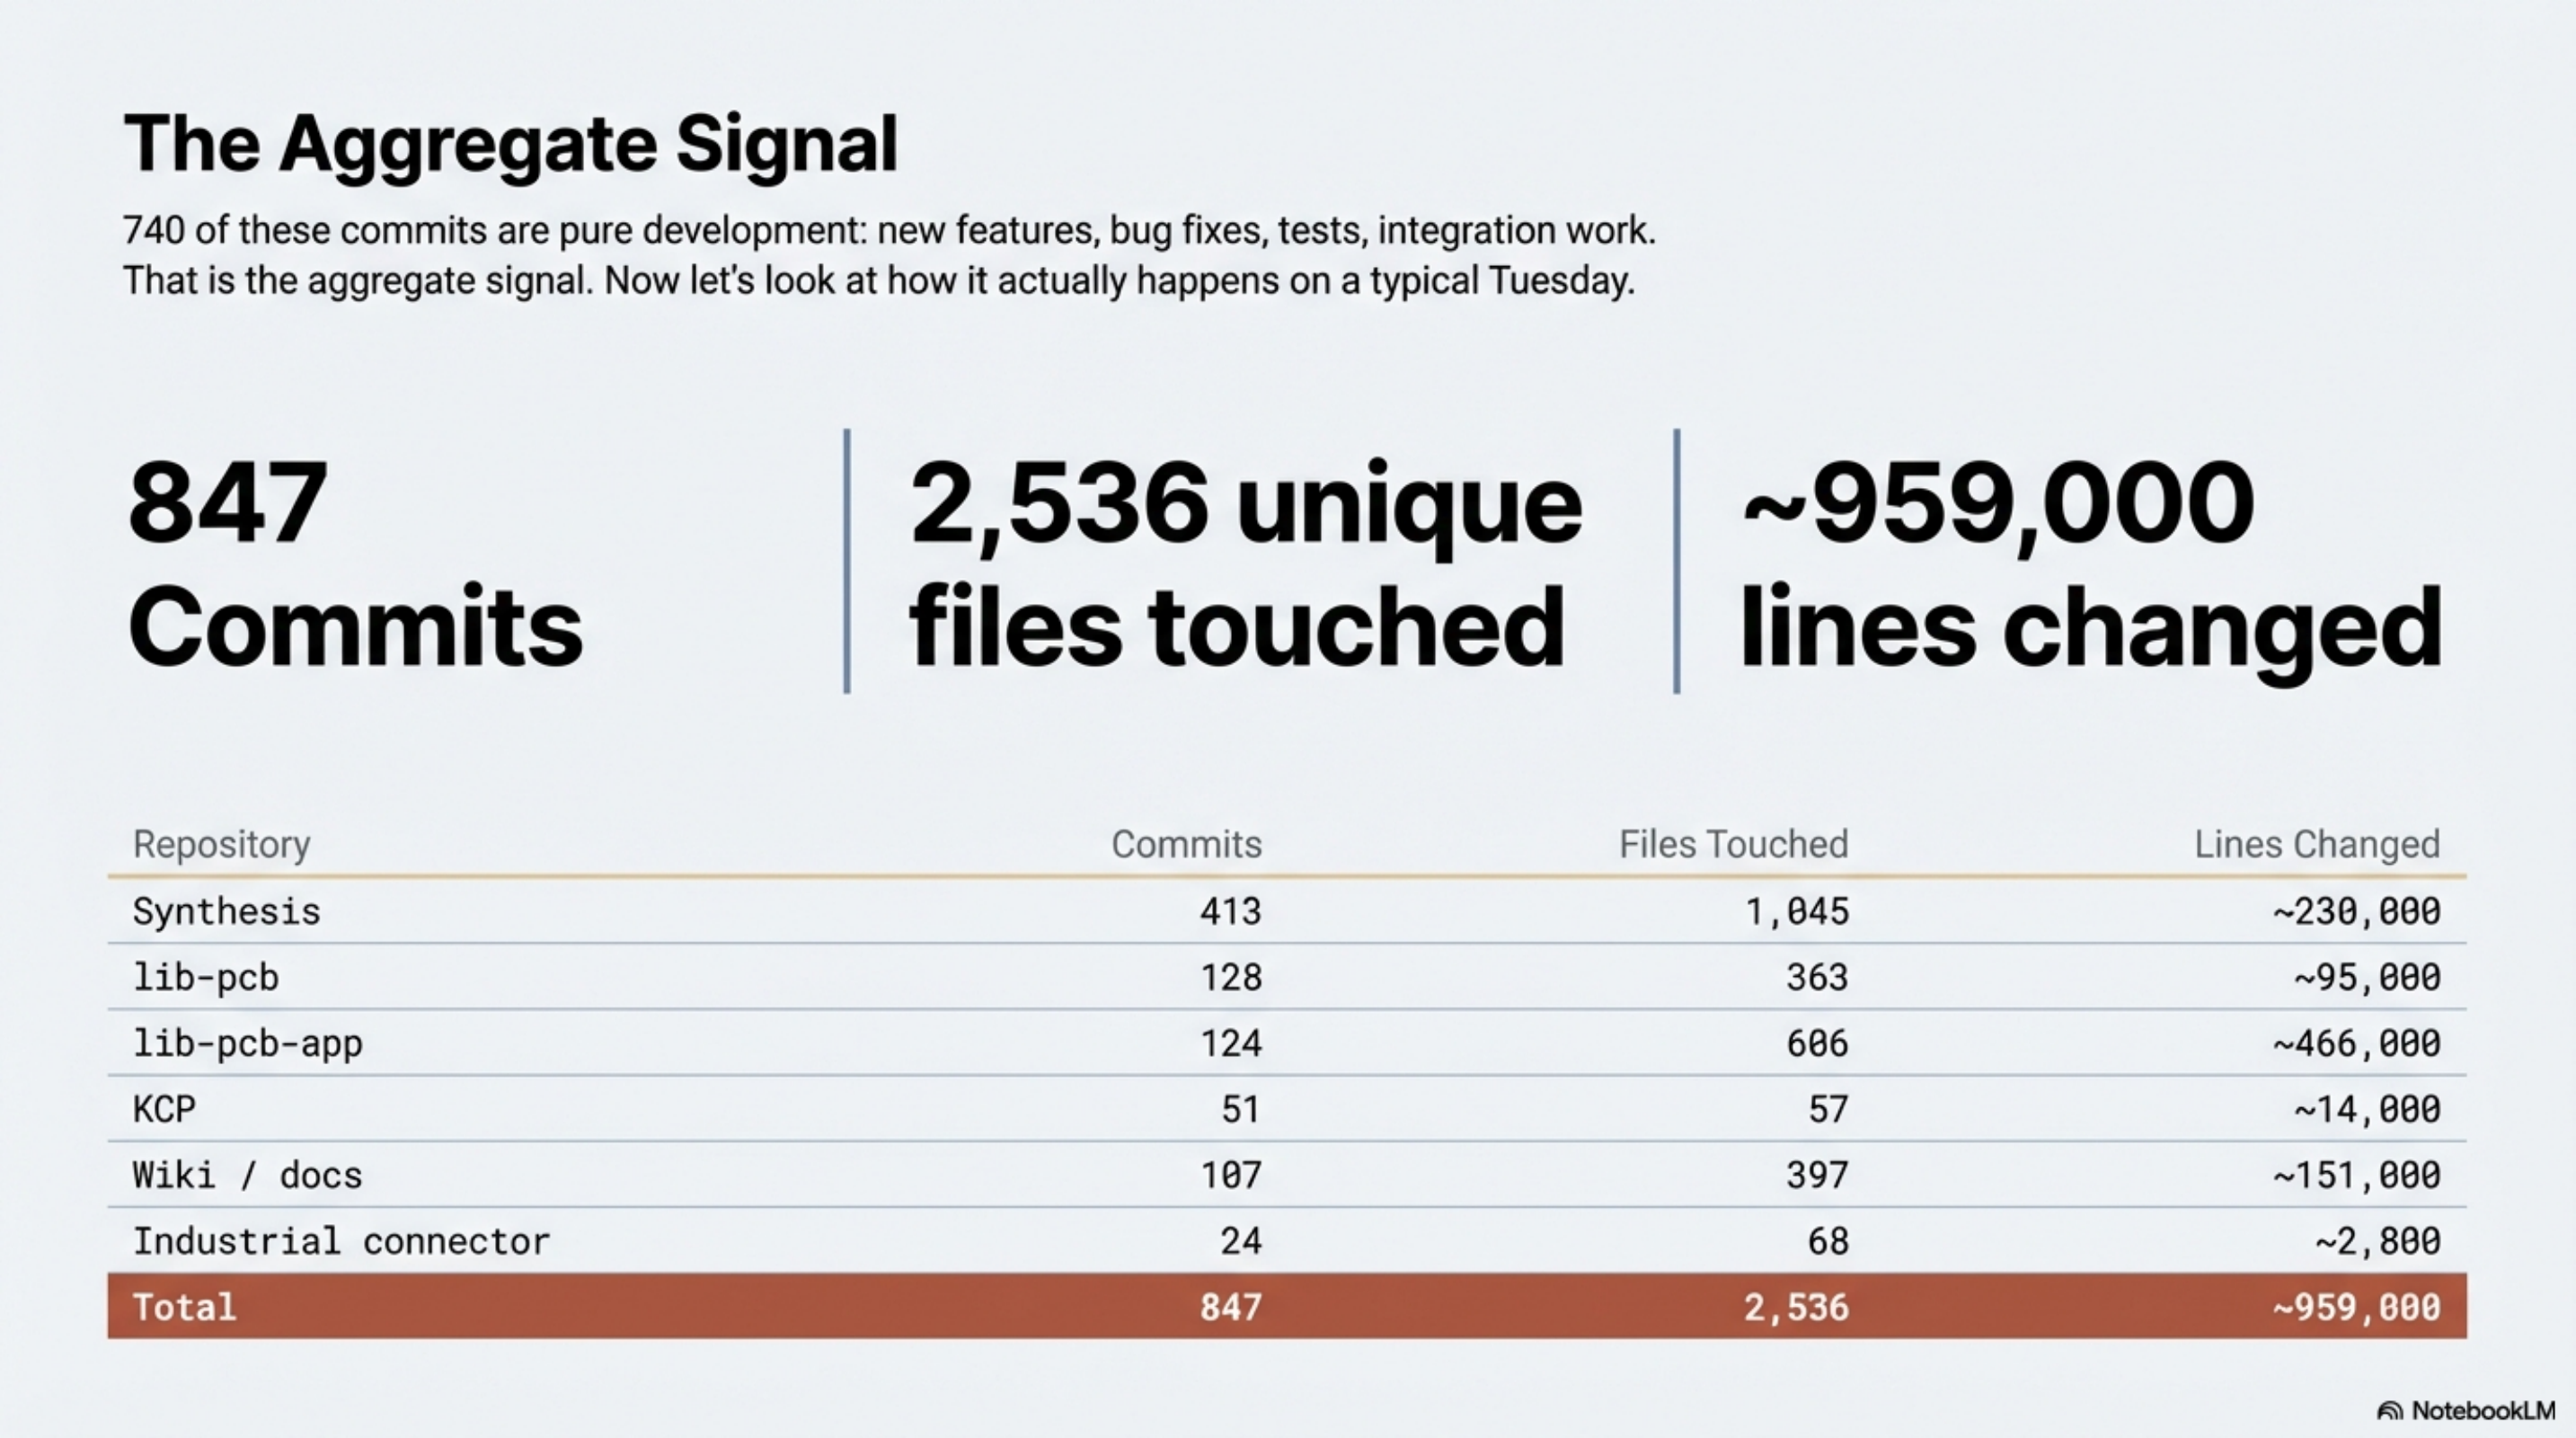
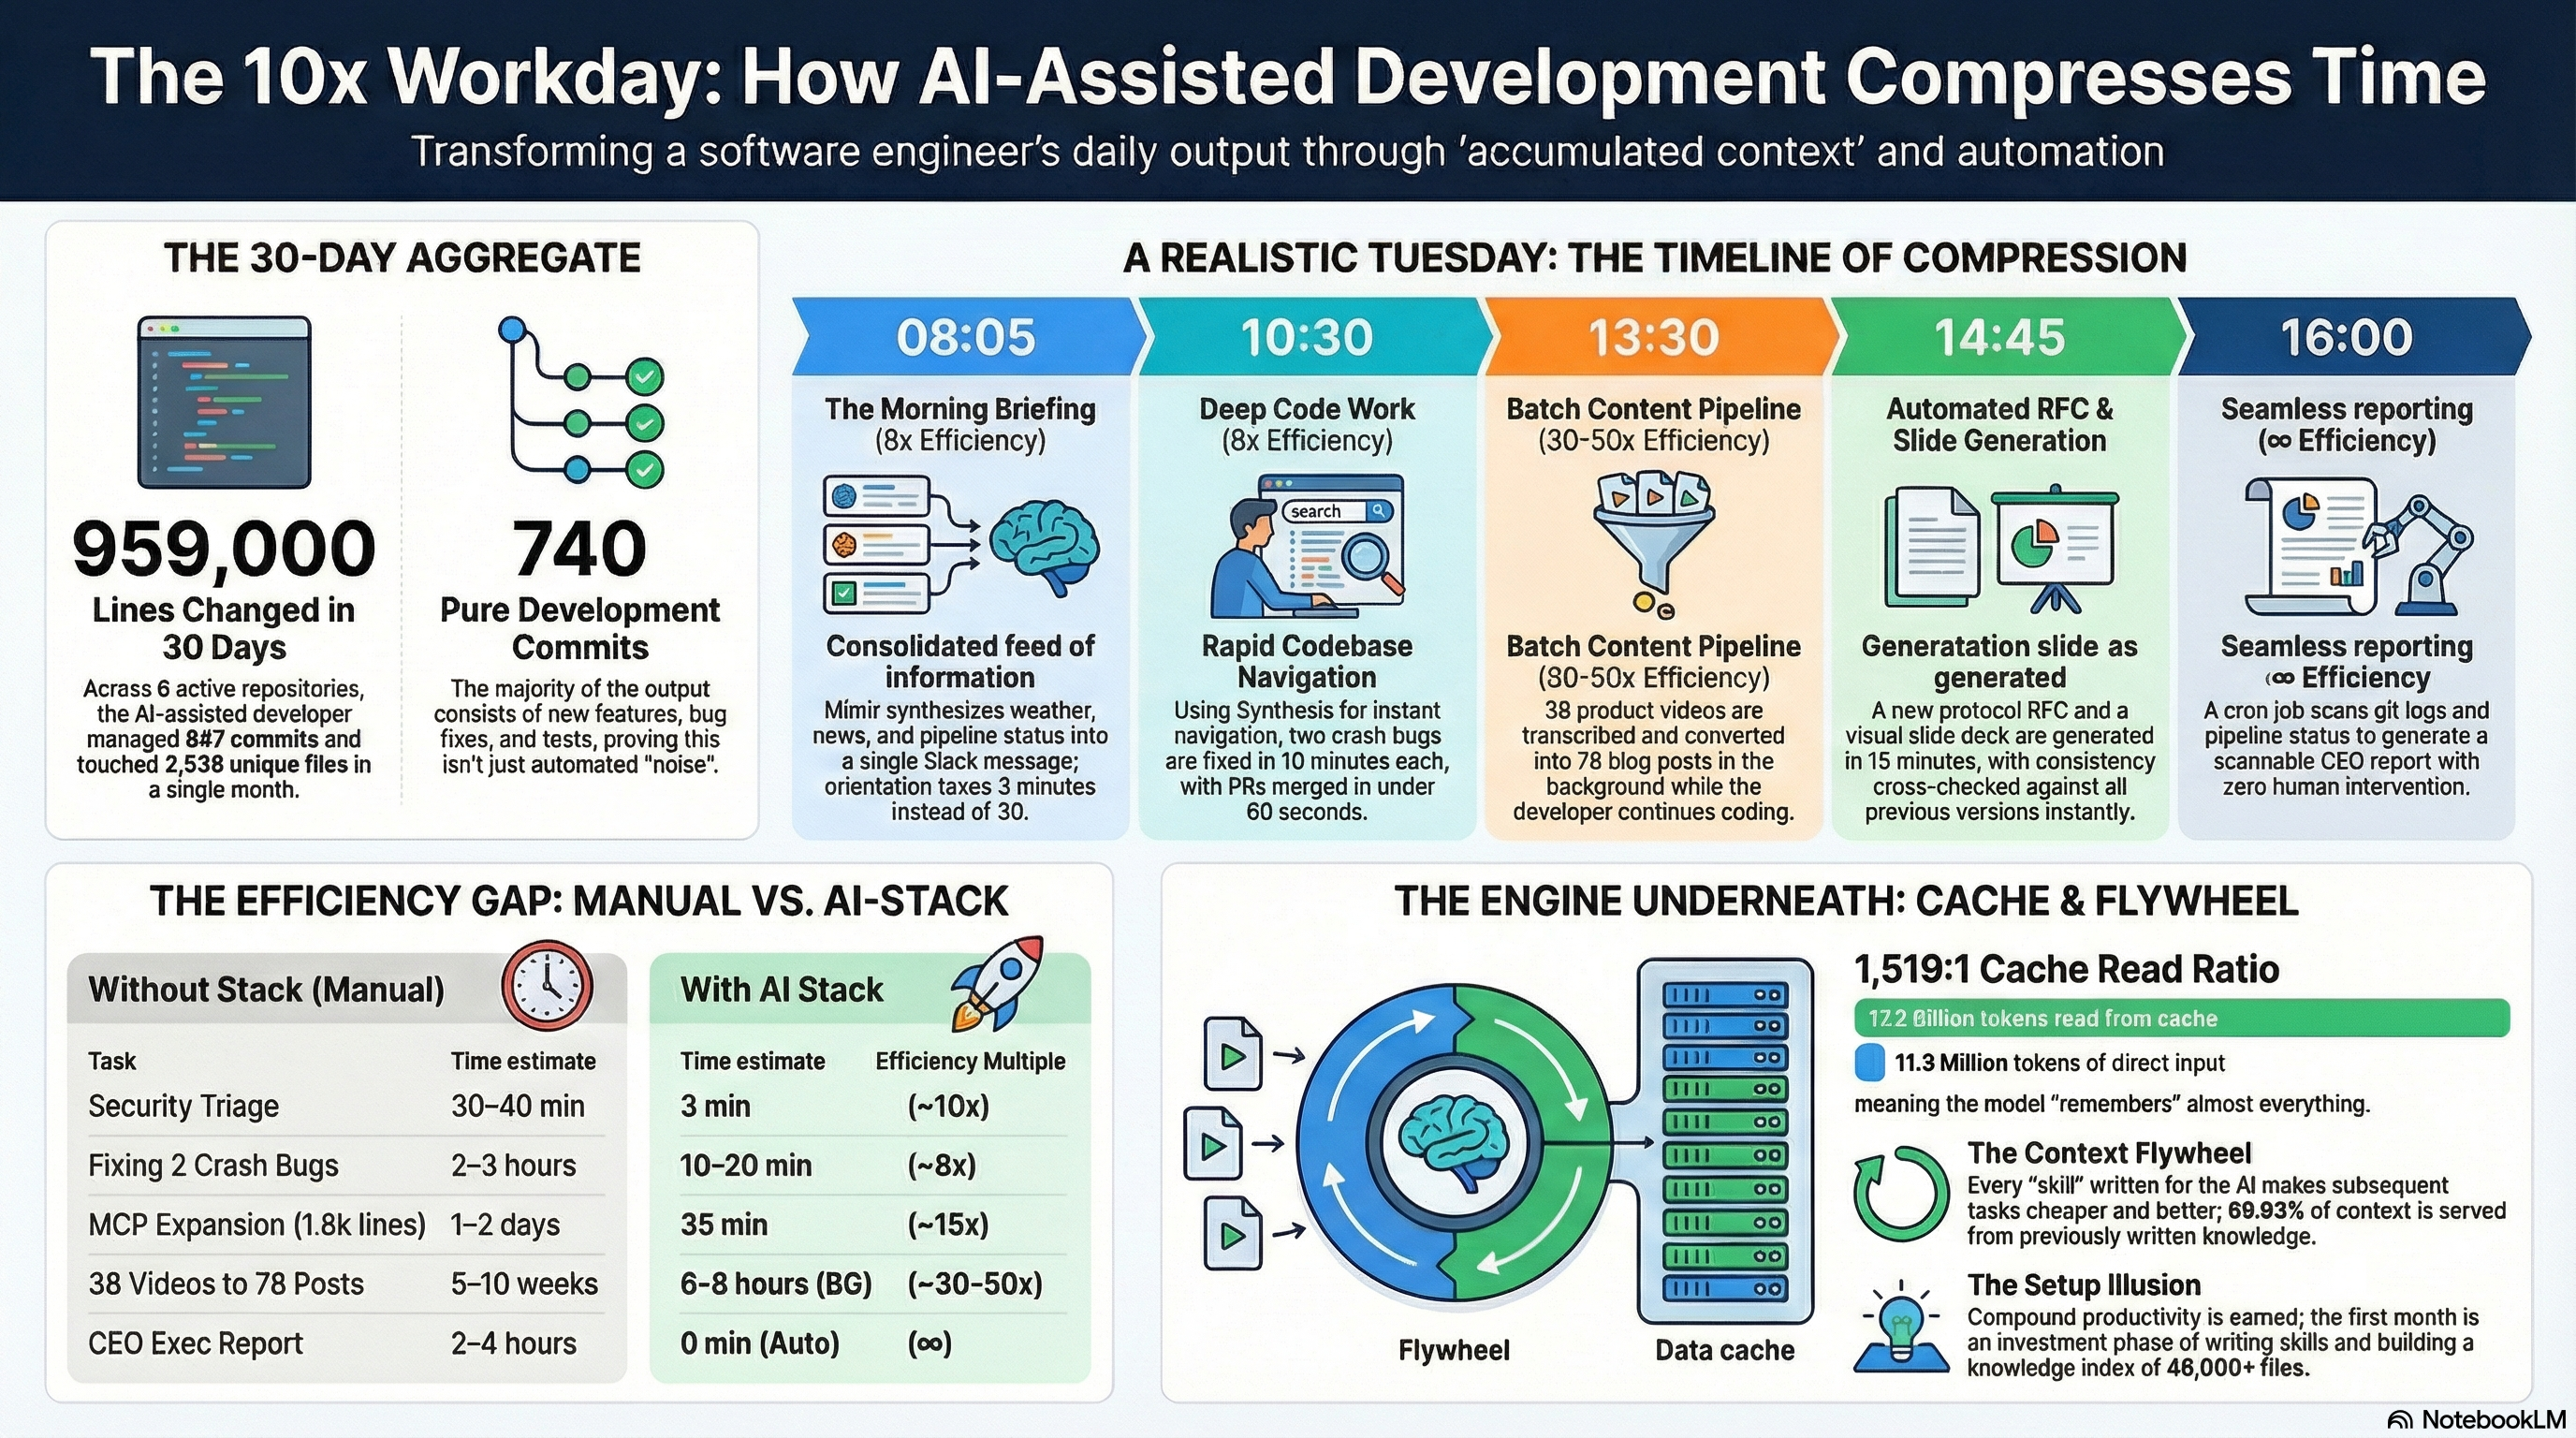
847 commits. 2,536 unique files touched. Roughly 959,000 lines changed across six projects in a single month. 740 of those commits are pure development: new features, bug fixes, tests, integration work. That is the aggregate signal. The question is what a single day inside that aggregate actually looks like.
Not a best-case Tuesday. A realistic one.
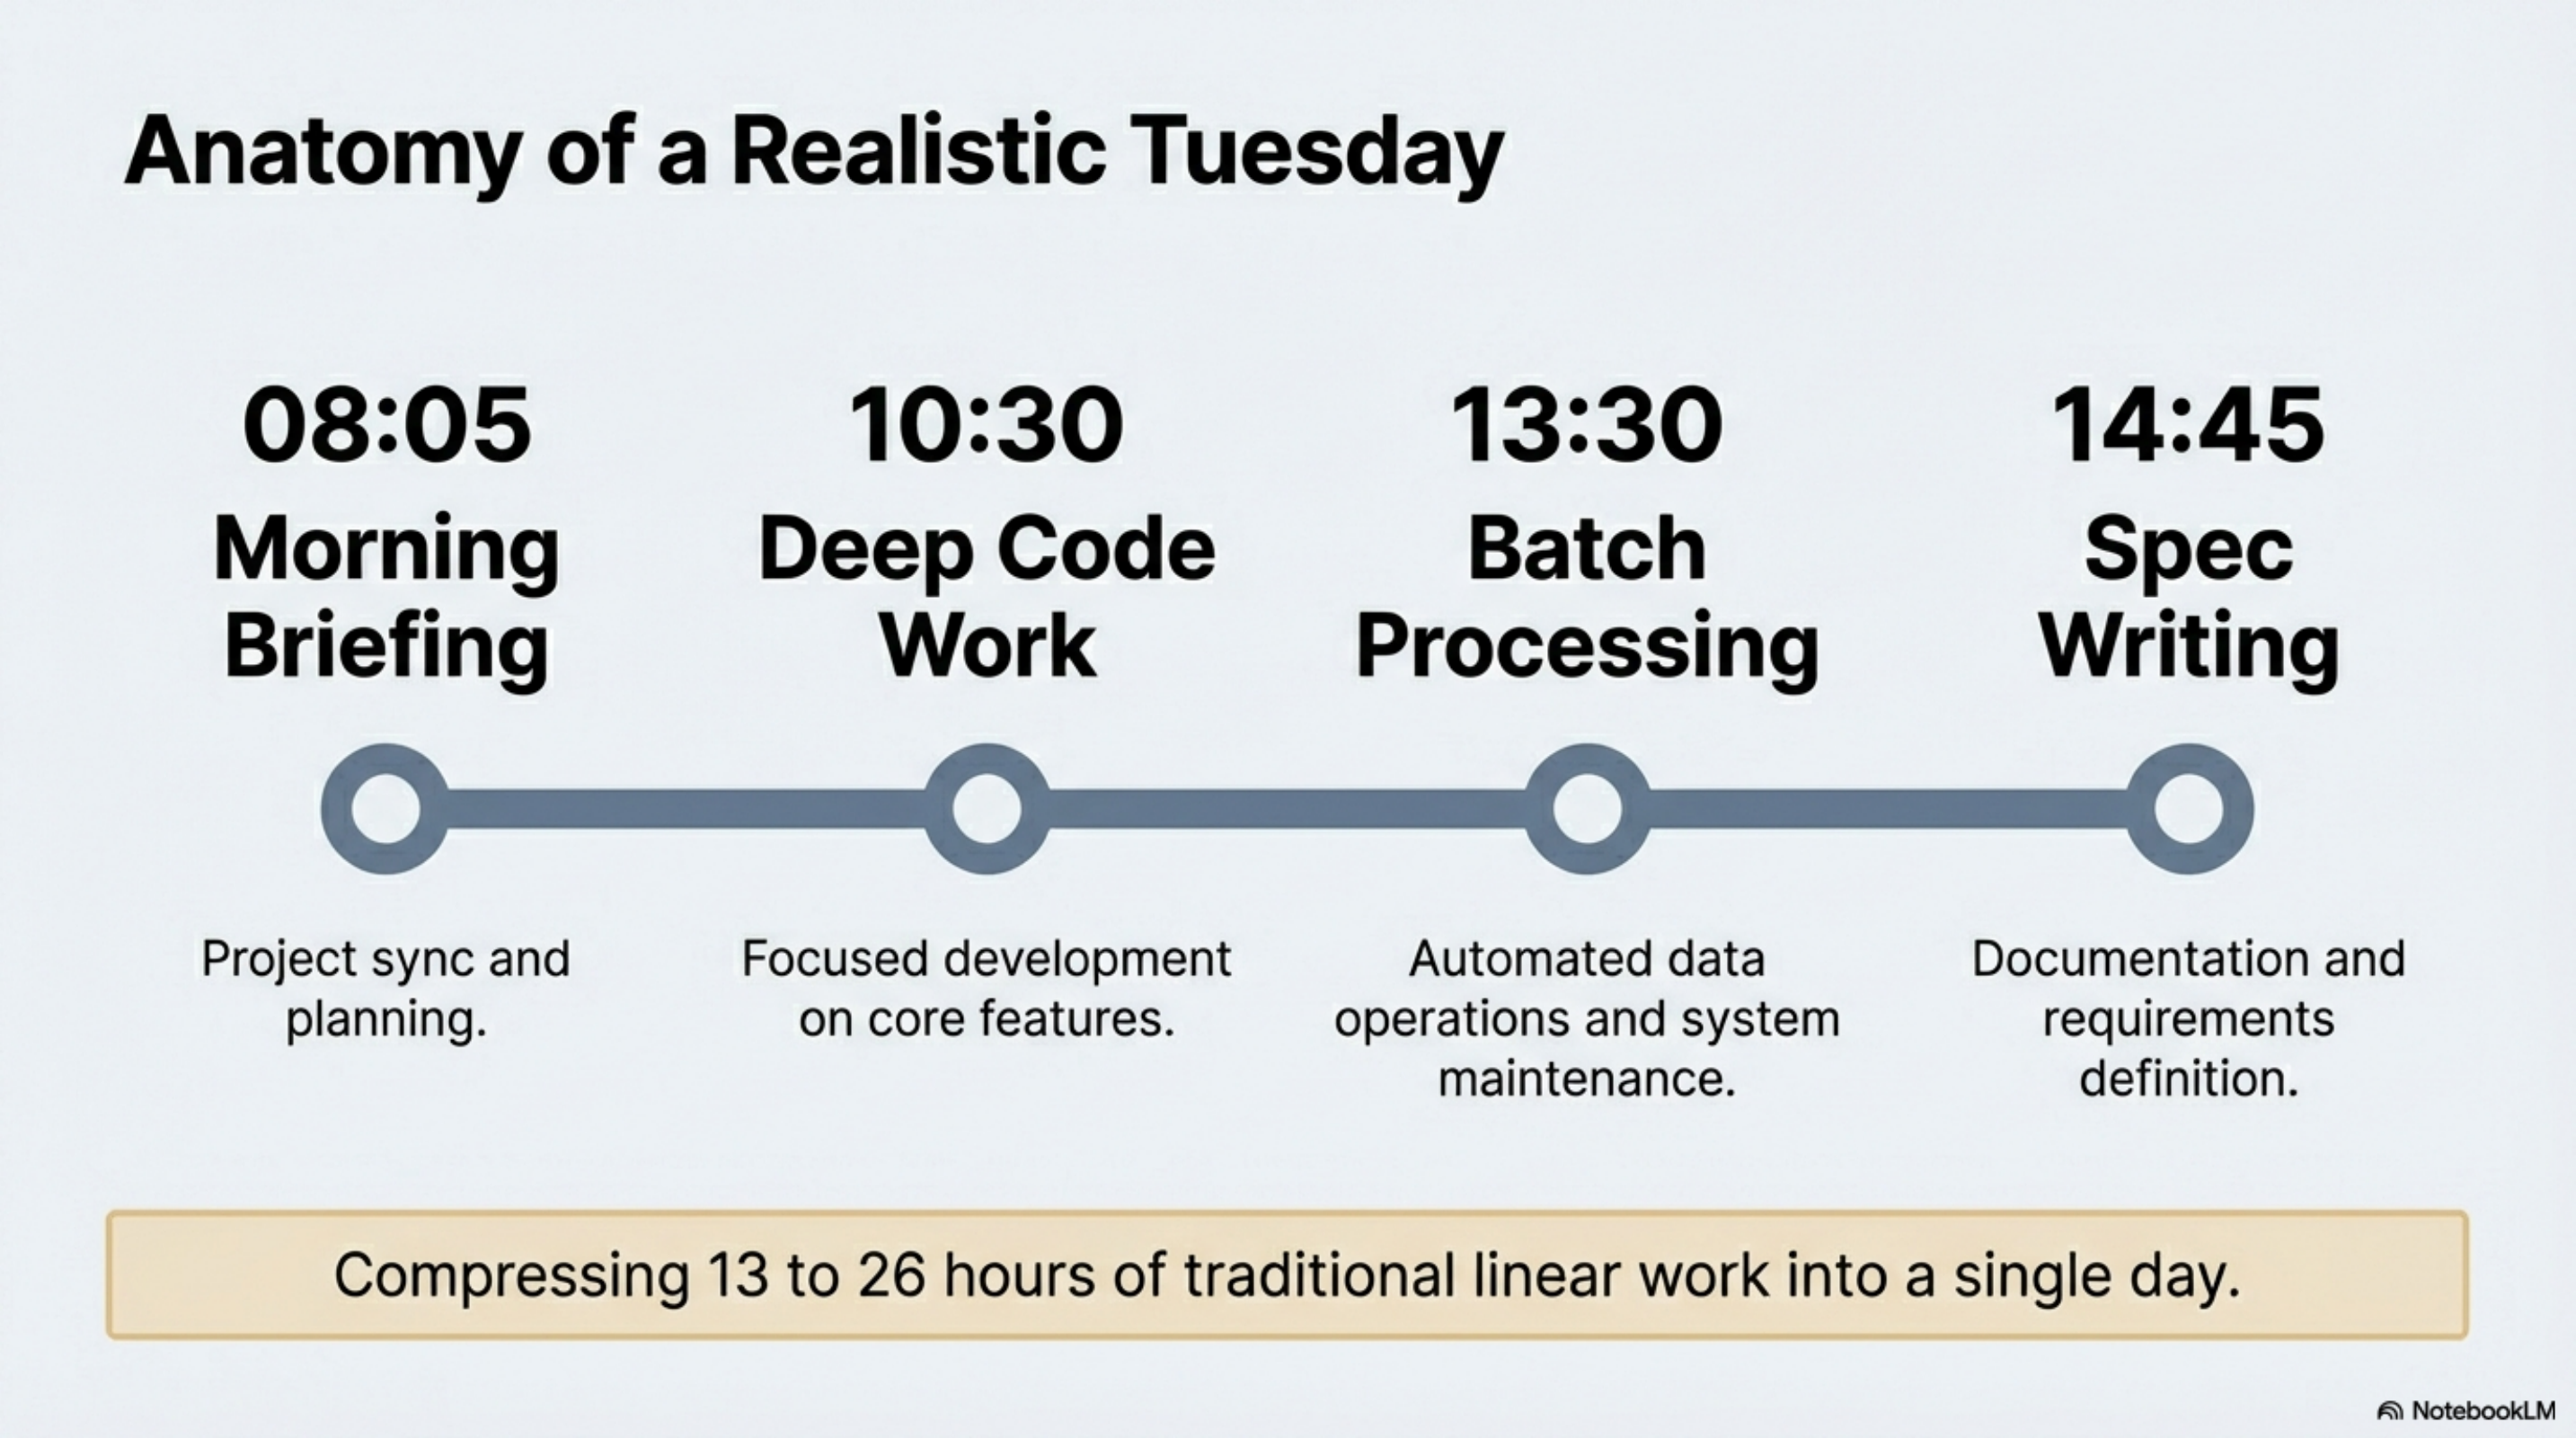
08:05 — Morning briefing arrives in Slack
Before I open a terminal, Mímir has already synthesized Oslo weather, flagged the five most relevant Hacker News items, summarized pipeline status, and noted what Synthesis tracked as changed in the past 24 hours. The morning-context.md is generated locally from pipeline status, network index, and the Synthesis changelog — stripped of ANSI codes, pushed to the EC2 agent hourly between 07:00 and 19:00 Oslo time. Worst-case staleness: 60 minutes.
The briefing also includes Klaw's overnight security findings, already triaged by severity. By the time I read it, I know which three HIGH findings need attention today and which ones are noise.
Without the stack: Manual morning routine — check email, scan Hacker News, review notes from yesterday, check git logs across repos, manually check security tooling. Twenty to thirty minutes to get oriented, working from incomplete memory of where you left off.
With the stack: Read a single Slack message over coffee. Three minutes. The orientation happened before I was awake.
~8×. The number understates it. The qualitative difference is that I start the day already knowing what matters — including what Klaw found in Cantara at 05:30 — rather than spending the first half-hour reconstructing it.
09:00 — Quick admin: lead and LinkedIn
A prospect commented on a LinkedIn post three days ago. I send a follow-up that references the right context about their situation, connects to something specific about their work. Context doesn't need to be re-established — it's in the memory system. Draft in one pass, review, send, log.
While I'm in that mode, I write a short LinkedIn post about the incremental indexing feature I'm planning for Synthesis this morning — concrete observation, understated, from experience rather than from theory. The content skill knows the established tone patterns. One draft pass.
~4–5× across both tasks. The time in a follow-up is not writing — it is remembering. The stack handles the remembering.
Then I open a terminal.
10:30 — Development: the core of the day
This is where most of the day actually goes, and where the stack's impact is most concrete.
The 30-day aggregate does not come from batch pipelines. It comes from sessions like this one, replicated across most working days — moving through multiple codebases, fixing real bugs, shipping real features. To make this concrete rather than theoretical: a single day in this week saw 11 PRs merged into Synthesis — the MCP server expanded from a handful of tools to full CLI parity at 41 tools, the KCP export format shipped, two crash bugs were fixed, and the benchmark suite was updated. The week prior saw 29 in a single day when the Wave 1 foundation shipped. These are not exceptional days.
The Tuesday I am describing here is actually a quiet one. The preceding two weeks averaged 15,000+ net new lines per active day — Feb 20 alone was 29 PRs and +20,000 lines when the Wave 1 foundation shipped. This day: 11 PRs, +3,500 lines. That is what "more typical" looks like once the infrastructure matures and the burst phases settle into maintenance and incremental expansion.
10:30 — Synthesis: two crashes, back to back
Two bug reports came in overnight. First: CrossFormatLinker crashes with an OutOfMemoryError when indexing workspaces that contain large PNG files — the linker was loading full binary content into memory trying to extract relationships. Second: the enrich command fails silently on PDFs above a size threshold instead of generating a metadata-only companion.
These are the kind of bugs that only surface at scale. My workspace has thousands of binary files. A user's workspace did too, and they hit both in the same session.
Without the stack: Locate CrossFormatLinker.java in a project with 1,000+ Java files, read enough context to understand the linker's role in the indexing pipeline, understand why large binaries trigger OOM, write the guard. Then switch to the enrich path and do it again. 40–60 minutes of navigation before the first fix.
With the stack:
synthesis search "CrossFormatLinker binary content"      # → CrossFormatLinker.java immediately
synthesis relate CrossFormatLinker.java                  # → used by: MaintainCommand, IndexRunner; 8 callers
I am in the right file in under two minutes. The product context skill has the architecture conventions loaded — the indexing pipeline stages, the SQLite knowledge graph schema, the existing patterns for binary-file handling in the enrichment path. I write both fixes with full context of how they fit into the pipeline.
PR #255 (473 lines, 5 files — Feb 24, 13:05) and PR #258 (175 lines, 2 files — Feb 25, 07:57) — both fixed within 18 hours across two sessions. 5–10 minutes of actual work each. Because navigation is instant and the fix is a few lines of context-aware guard code, the actual work is almost entirely the problem itself.
One detail worth noting: both PRs were opened and merged within 44–54 seconds of creation. The review/approval overhead that typically accounts for 1–5 days of cycle time in a normal team is structurally absent. The work is in the code, not the process.
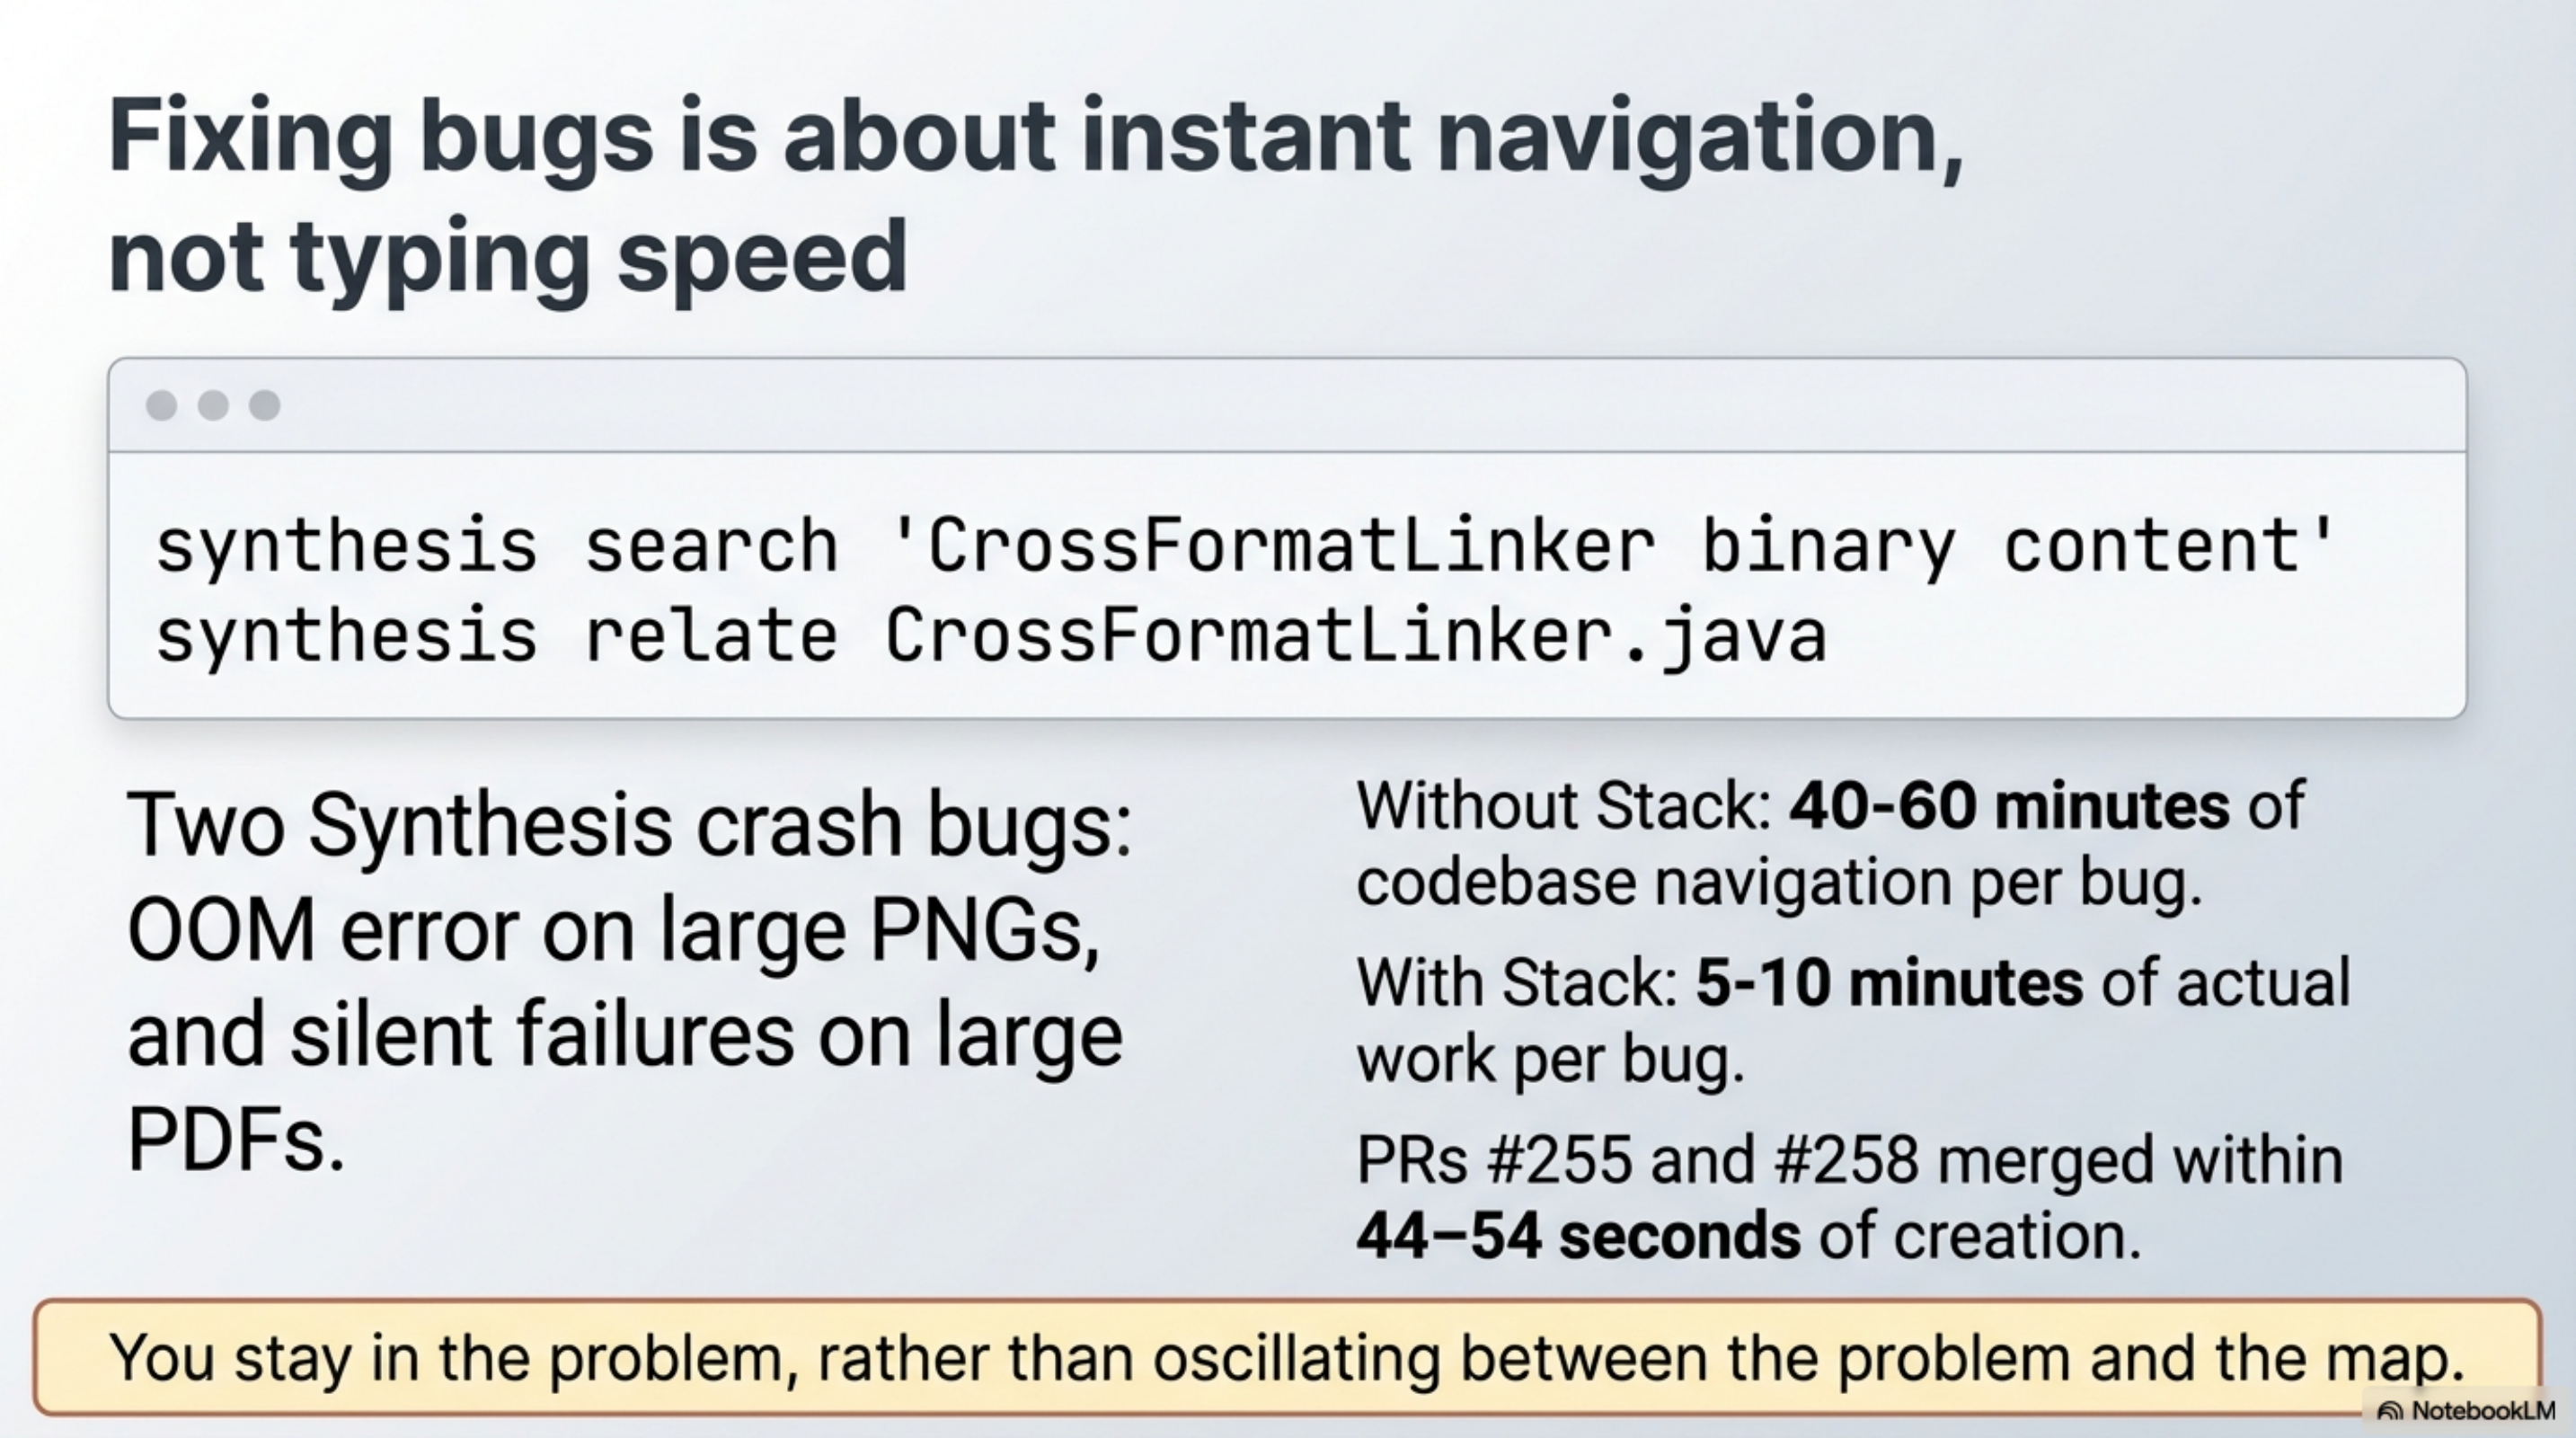
~8×. The subjective experience matters more than the multiplier: I stay in the problem rather than oscillating between the problem and the map.
11:20 — Synthesis: security false-positive rate
Earlier in the week, the code-graph security feature shipped — 21 detection signals across two severity tiers, covering hardcoded secrets, SQL injection patterns, known CVE dependency matches, and agentic AI risks (PR #234). Running it against the Synthesis codebase itself immediately surfaced false positives: four detectors (S001, S002, S011, S021) were triggering on patterns that look like vulnerabilities but are not in context.
This is the fastest feedback loop for a security scanner: ship it, run it on yourself, fix what's wrong.
synthesis code-graph security --severity HIGH    # run on own codebase
synthesis search "S001 detector pattern"         # find the relevant detector class
synthesis relate SecurityAnalyzer.java           # understand the signal pipeline
The false positive patterns were specific: S001 was matching string concatenation in log messages (not SQL injection), S011 was flagging intentional test data. Each detector fix is a few lines of context-aware filtering.
PR #242: fix(security): reduce false positives in S001, S002, S011, S021 detectors. 27 lines changed across 2 files. 5–10 minutes. Without instant navigation to the detector classes, this would have been a 90-minute read-through.
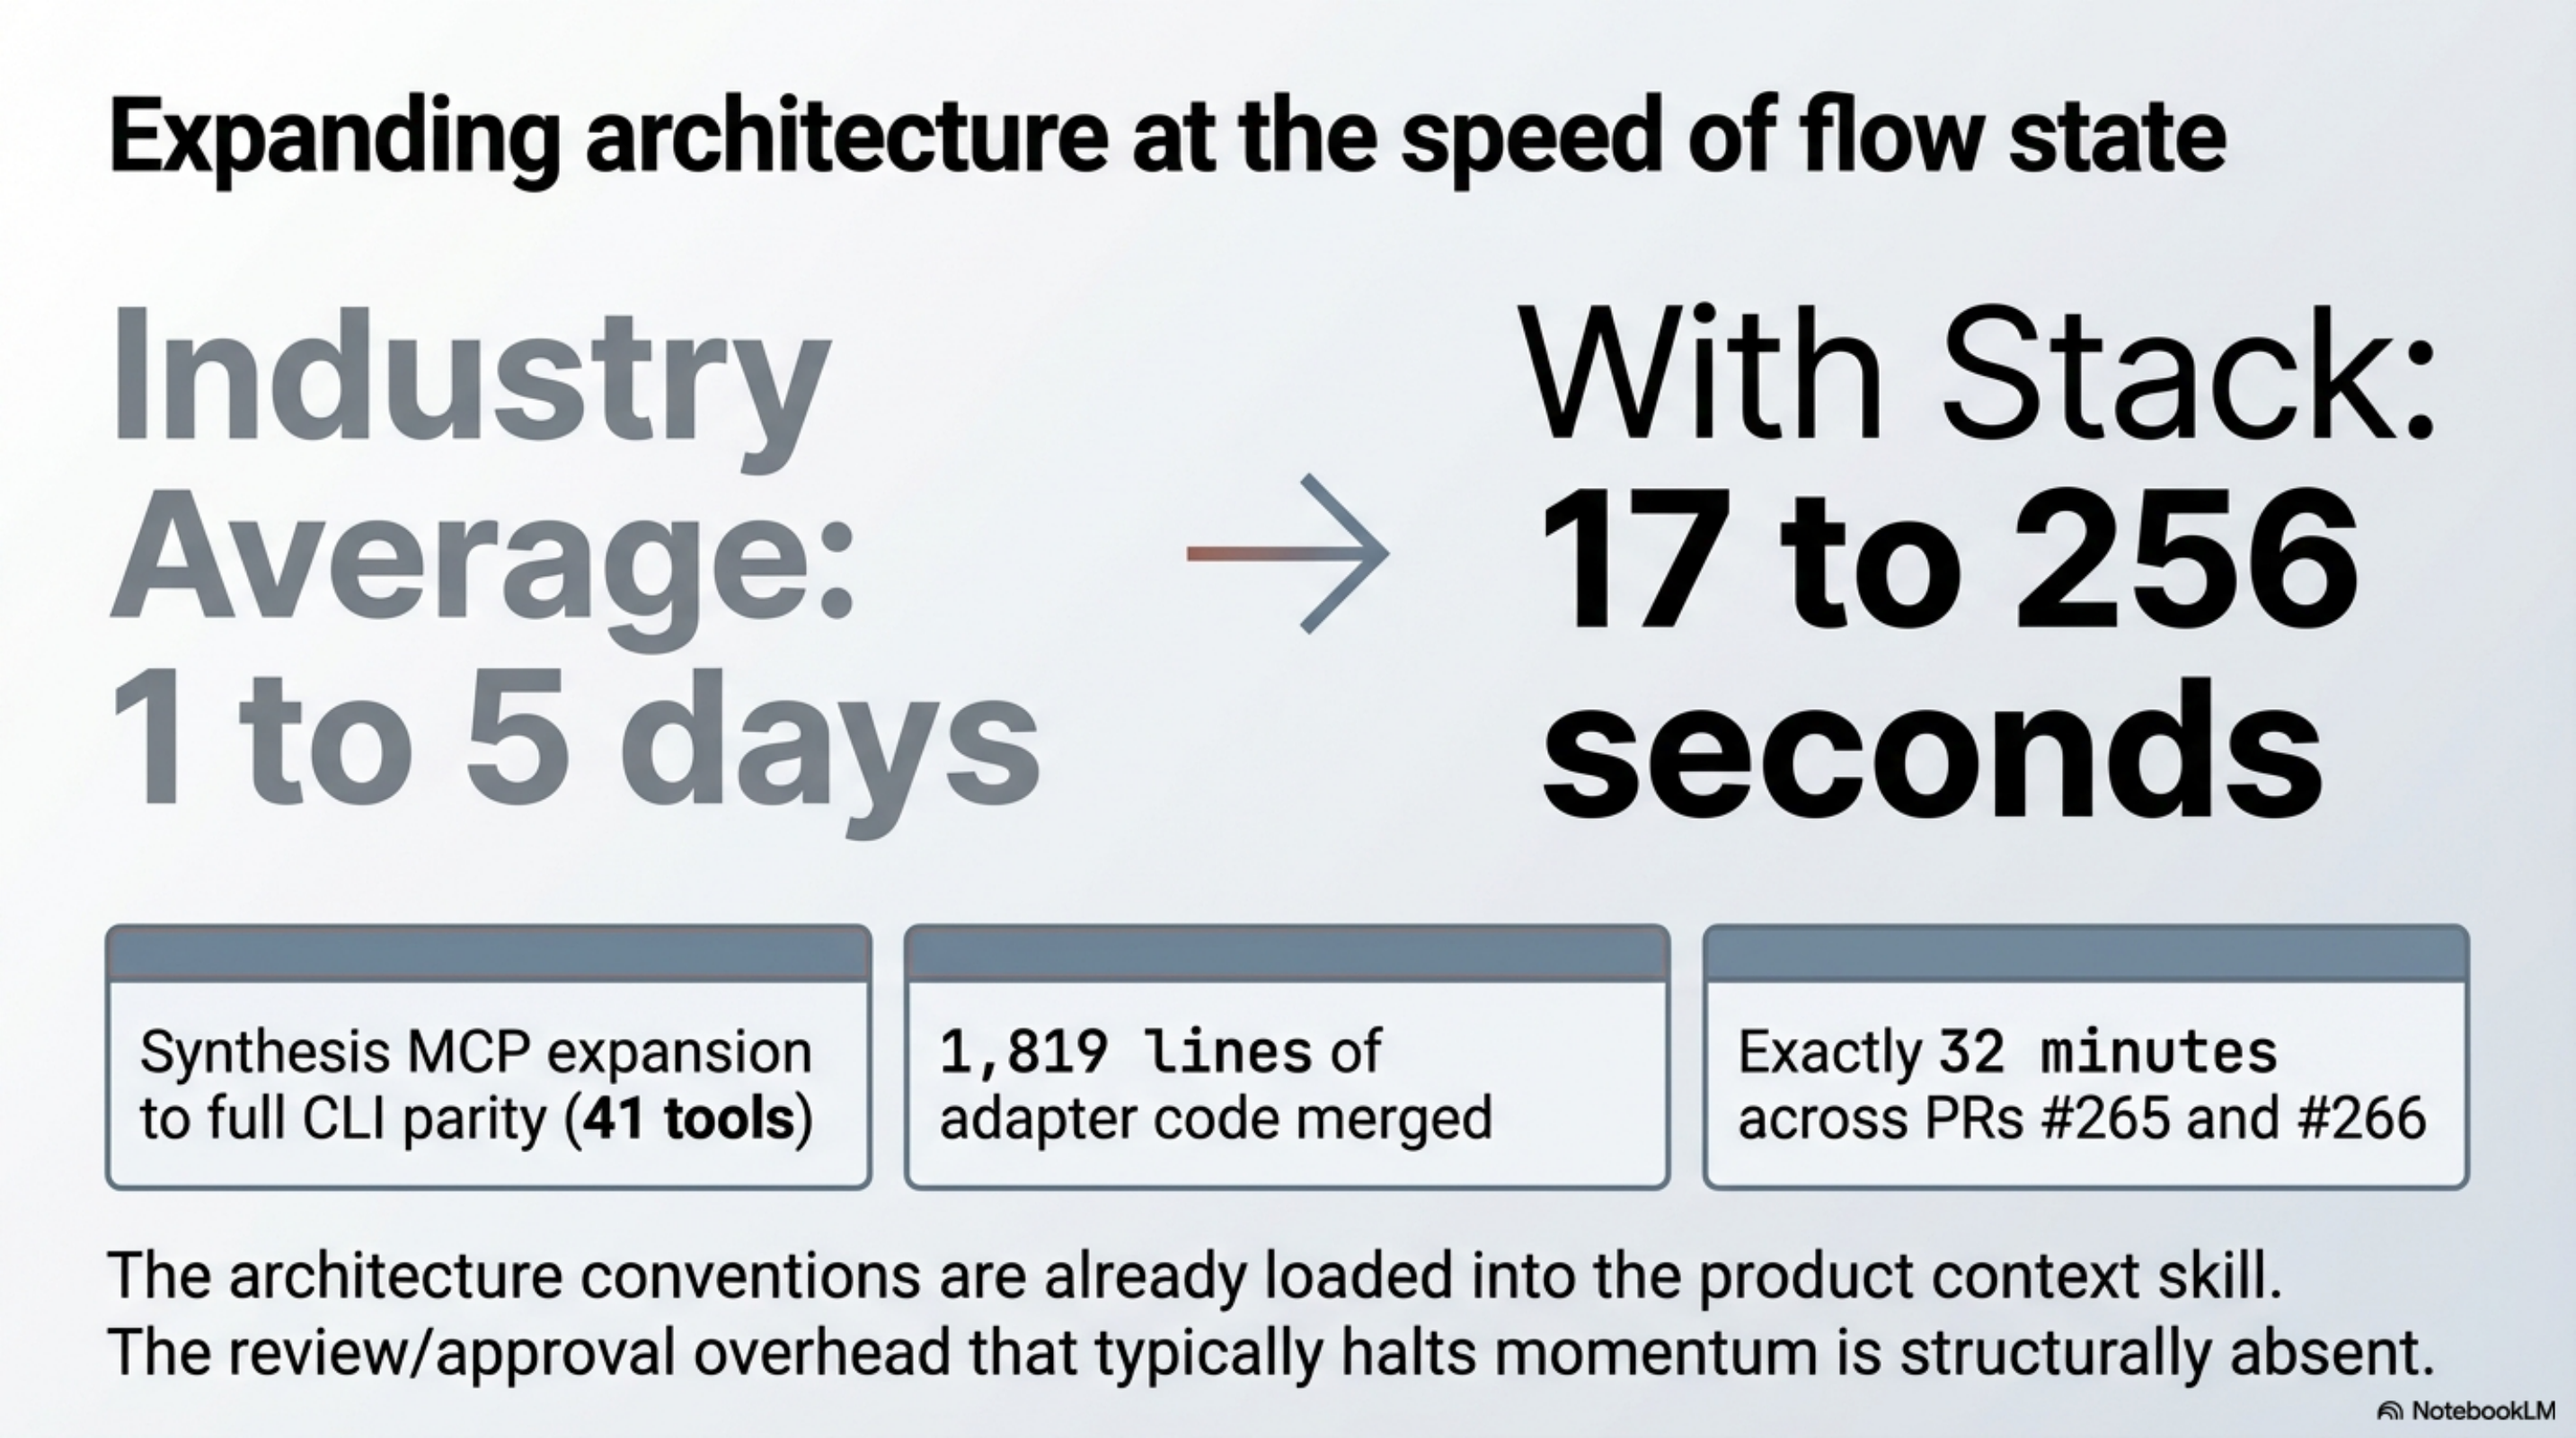
12:00 — Synthesis MCP: expanding to full CLI parity
The MCP server registered inside Claude Code currently exposes a subset of Synthesis commands. The goal is full parity — every CLI capability available as an MCP tool so the model never needs to drop to a subprocess call.
This is a larger task: six new tools to add (PR #265: changelog, report, health, security, impact, export), then the full 41-tool suite (PR #266), then decision heuristics added to tool descriptions so the model routes correctly (PR #274).
synthesis search "MCP tool registration StreamableHTTP"  # → SynthesisMcpServer.java
synthesis relate SynthesisMcpServer.java                 # → 6 tool registration interfaces
synthesis impact McpToolBase.java                        # blast radius for the base class change
The architecture is already established — each tool is a registered class implementing a thin interface over the existing CLI command. Navigation takes seconds. Writing the tool adapters takes the bulk of the time.
The timestamps tell the story directly: #265 merged at 16:10, #266 merged at 16:42 — 32 minutes for 1,819 lines of adapter code covering the full CLI surface. #274 (decision heuristics, 24 lines) came two hours later as a separate tuning pass. The end state: Claude Code can call synthesis impact, synthesis security, synthesis changelog directly without me knowing those tools exist — the model discovers them from the registered descriptions.
13:00 — Cantara dependency maintenance (automated)
While the development sessions above were running, the Cantara ecosystem was maintaining itself. Renovate bot runs continuously across all 62 Cantara repositories, filing and auto-merging routine dependency updates. This week alone: logback-classic to v1.5.32 across Whydah-CRMService, ConfigService, visuale, and others — a coordinated update across a dozen services, zero human time.
What Klaw adds on top of Renovate's routine automation: the CVE analysis layer. Klaw runs synthesis code-graph security against the full Cantara workspace at 05:30 and surfaces findings that Renovate's version-bump logic misses — dependencies that are current but vulnerable, hardcoded credentials, security patterns that require understanding the codebase rather than just the dependency version. Those findings go into the morning briefing. The routine patches are already handled. What I review is what requires judgment.
The morning briefing's security section this week: 46 HIGH findings across 2,031 packages. Most are code quality signals. The ones worth a human look are the ones the briefing surfaces explicitly. I open three, close two as expected patterns, file one as a real issue.
13:30 — Batch content pipeline (running in background)
Earlier in the morning I queued 38 product videos for Whisper transcription. By 13:30 the batch is done. Two-speed treatment: five strategic videos get comprehensive handling (15–25K words each). Thirty-three supporting videos get rapid mode (~8 minutes per video, 2–5K words each).
End state: 78 blog posts, 85,000 lines of metadata, bidirectional cross-references between videos, posts, and the Synthesis index.
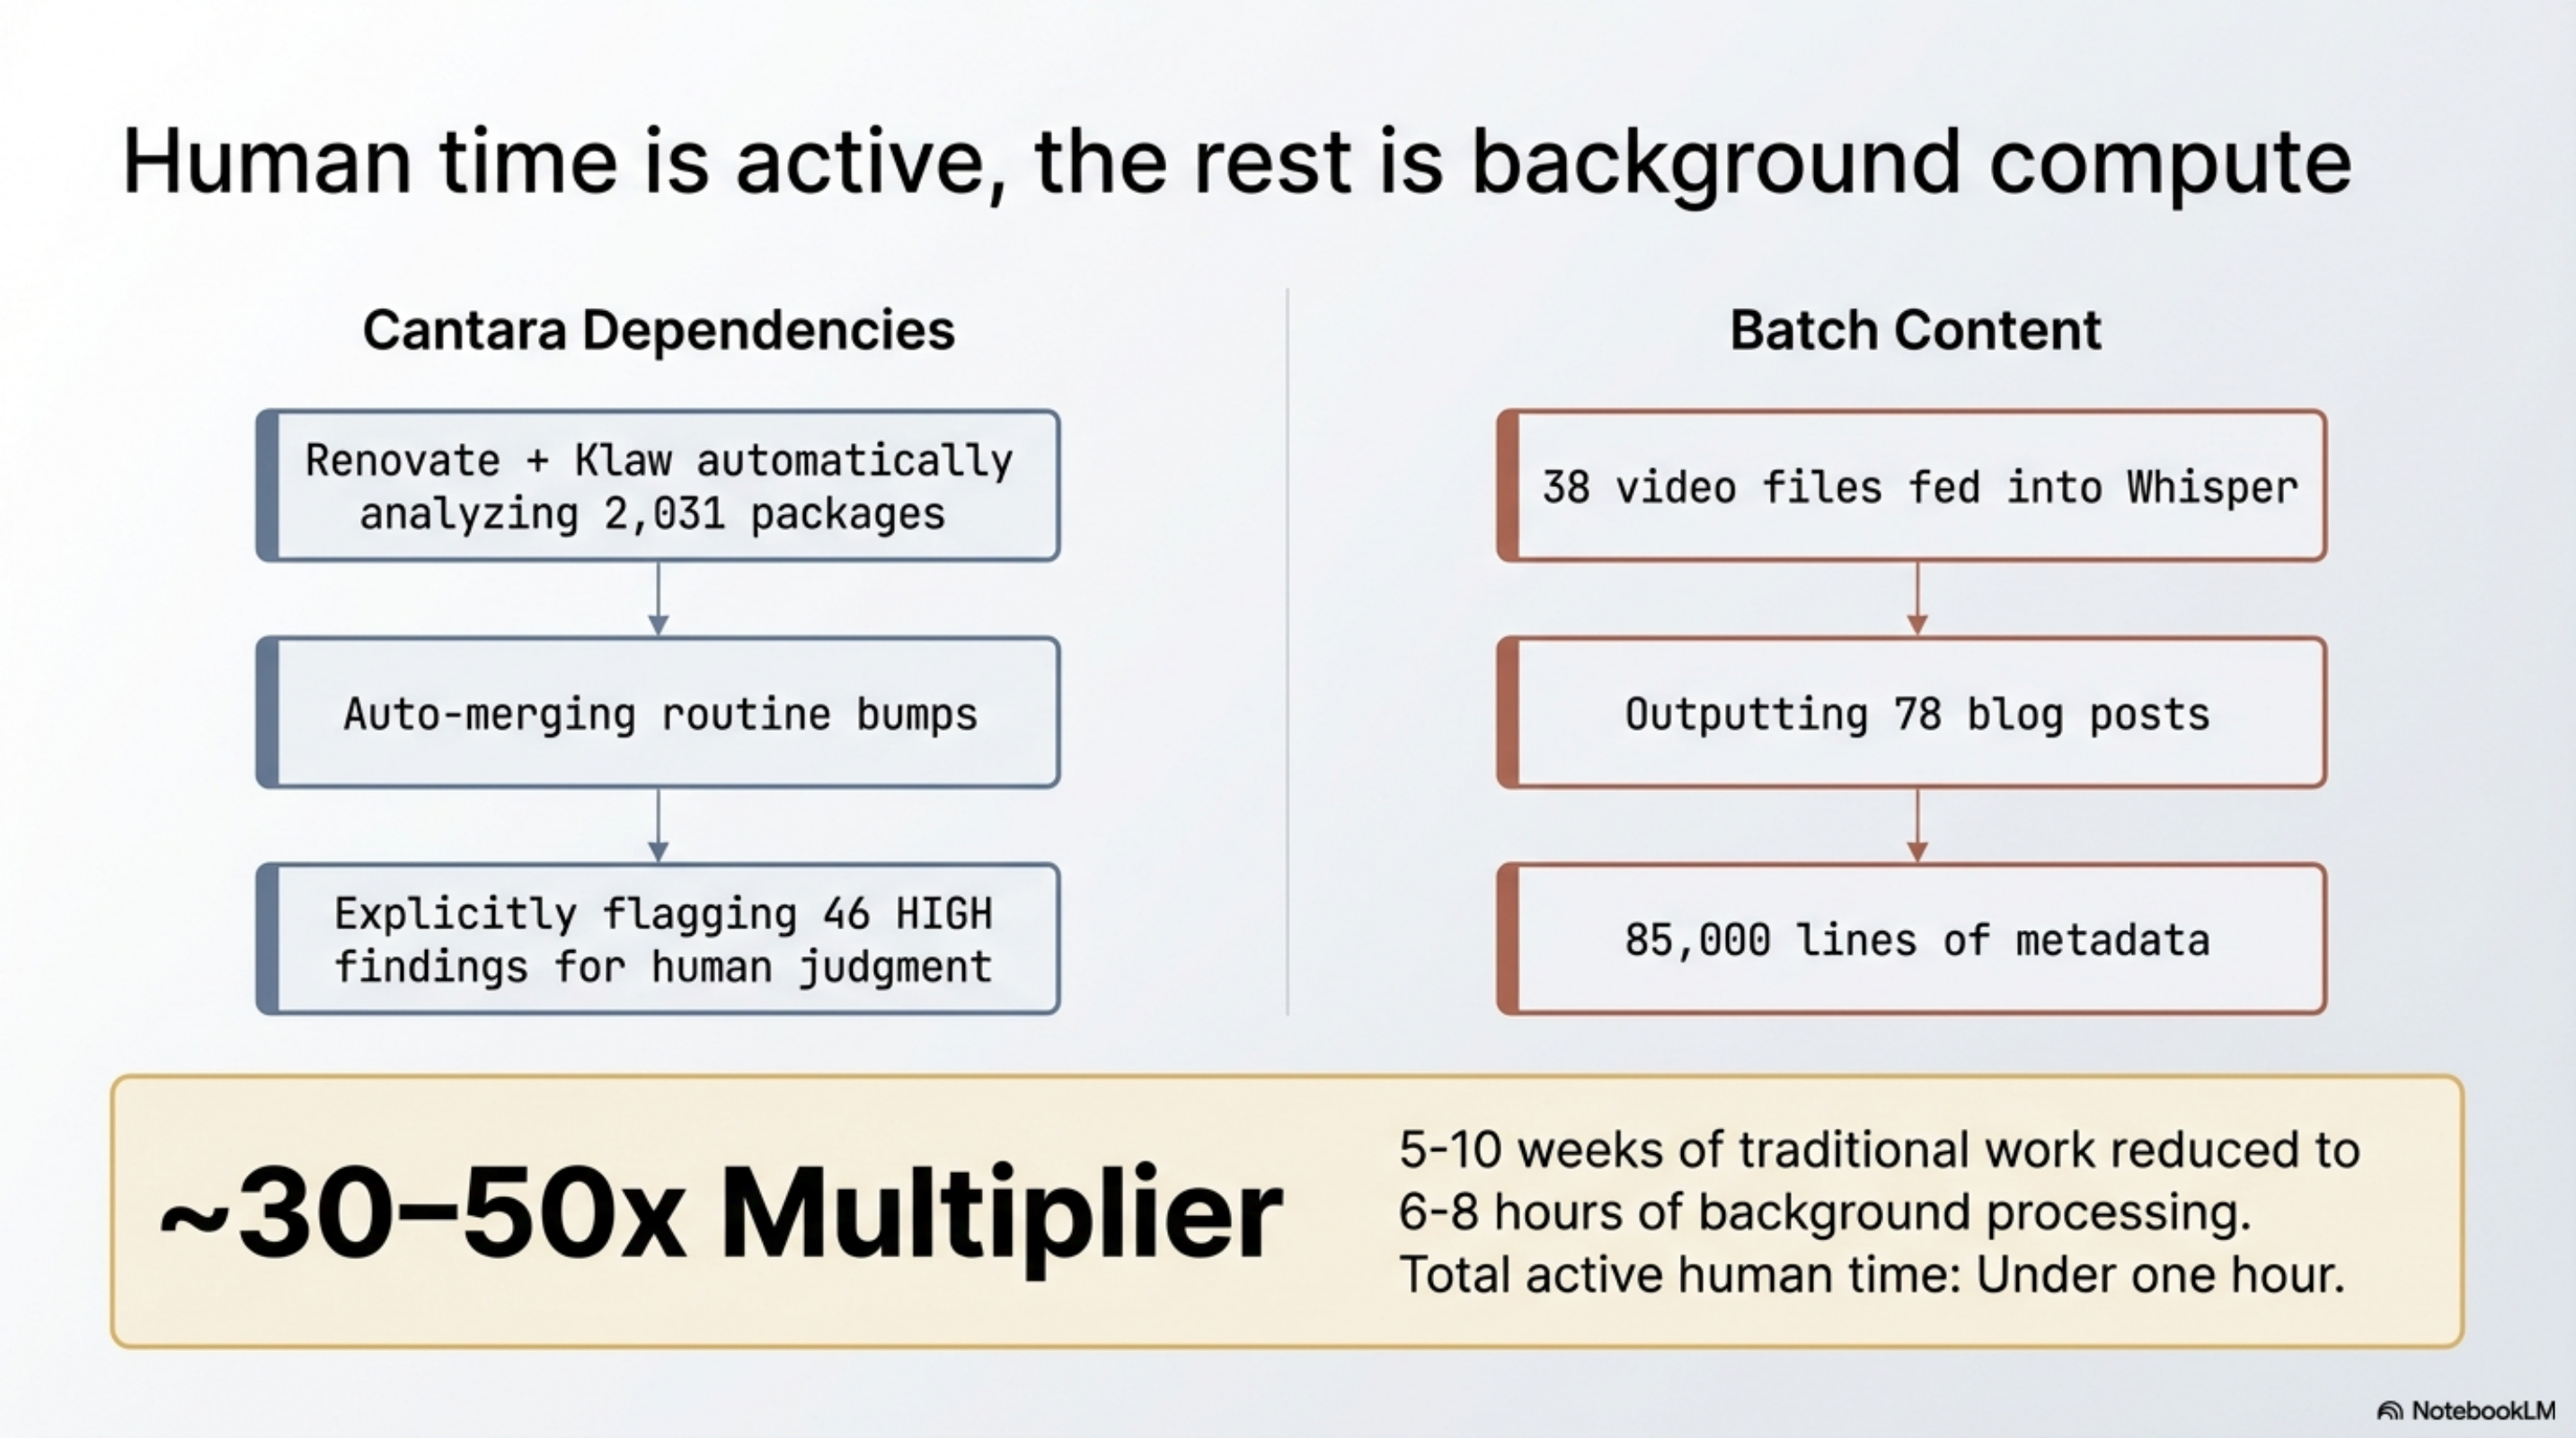
Total active time: under an hour (queuing, spot-checking, tagging). The rest was background processing while the development sessions above ran.
~30–50×. This is where the multiplier is largest, because the bottleneck was never writing quality — it was the sheer mechanical cost of transcription and reformatting that made the work prohibitive in the first place.
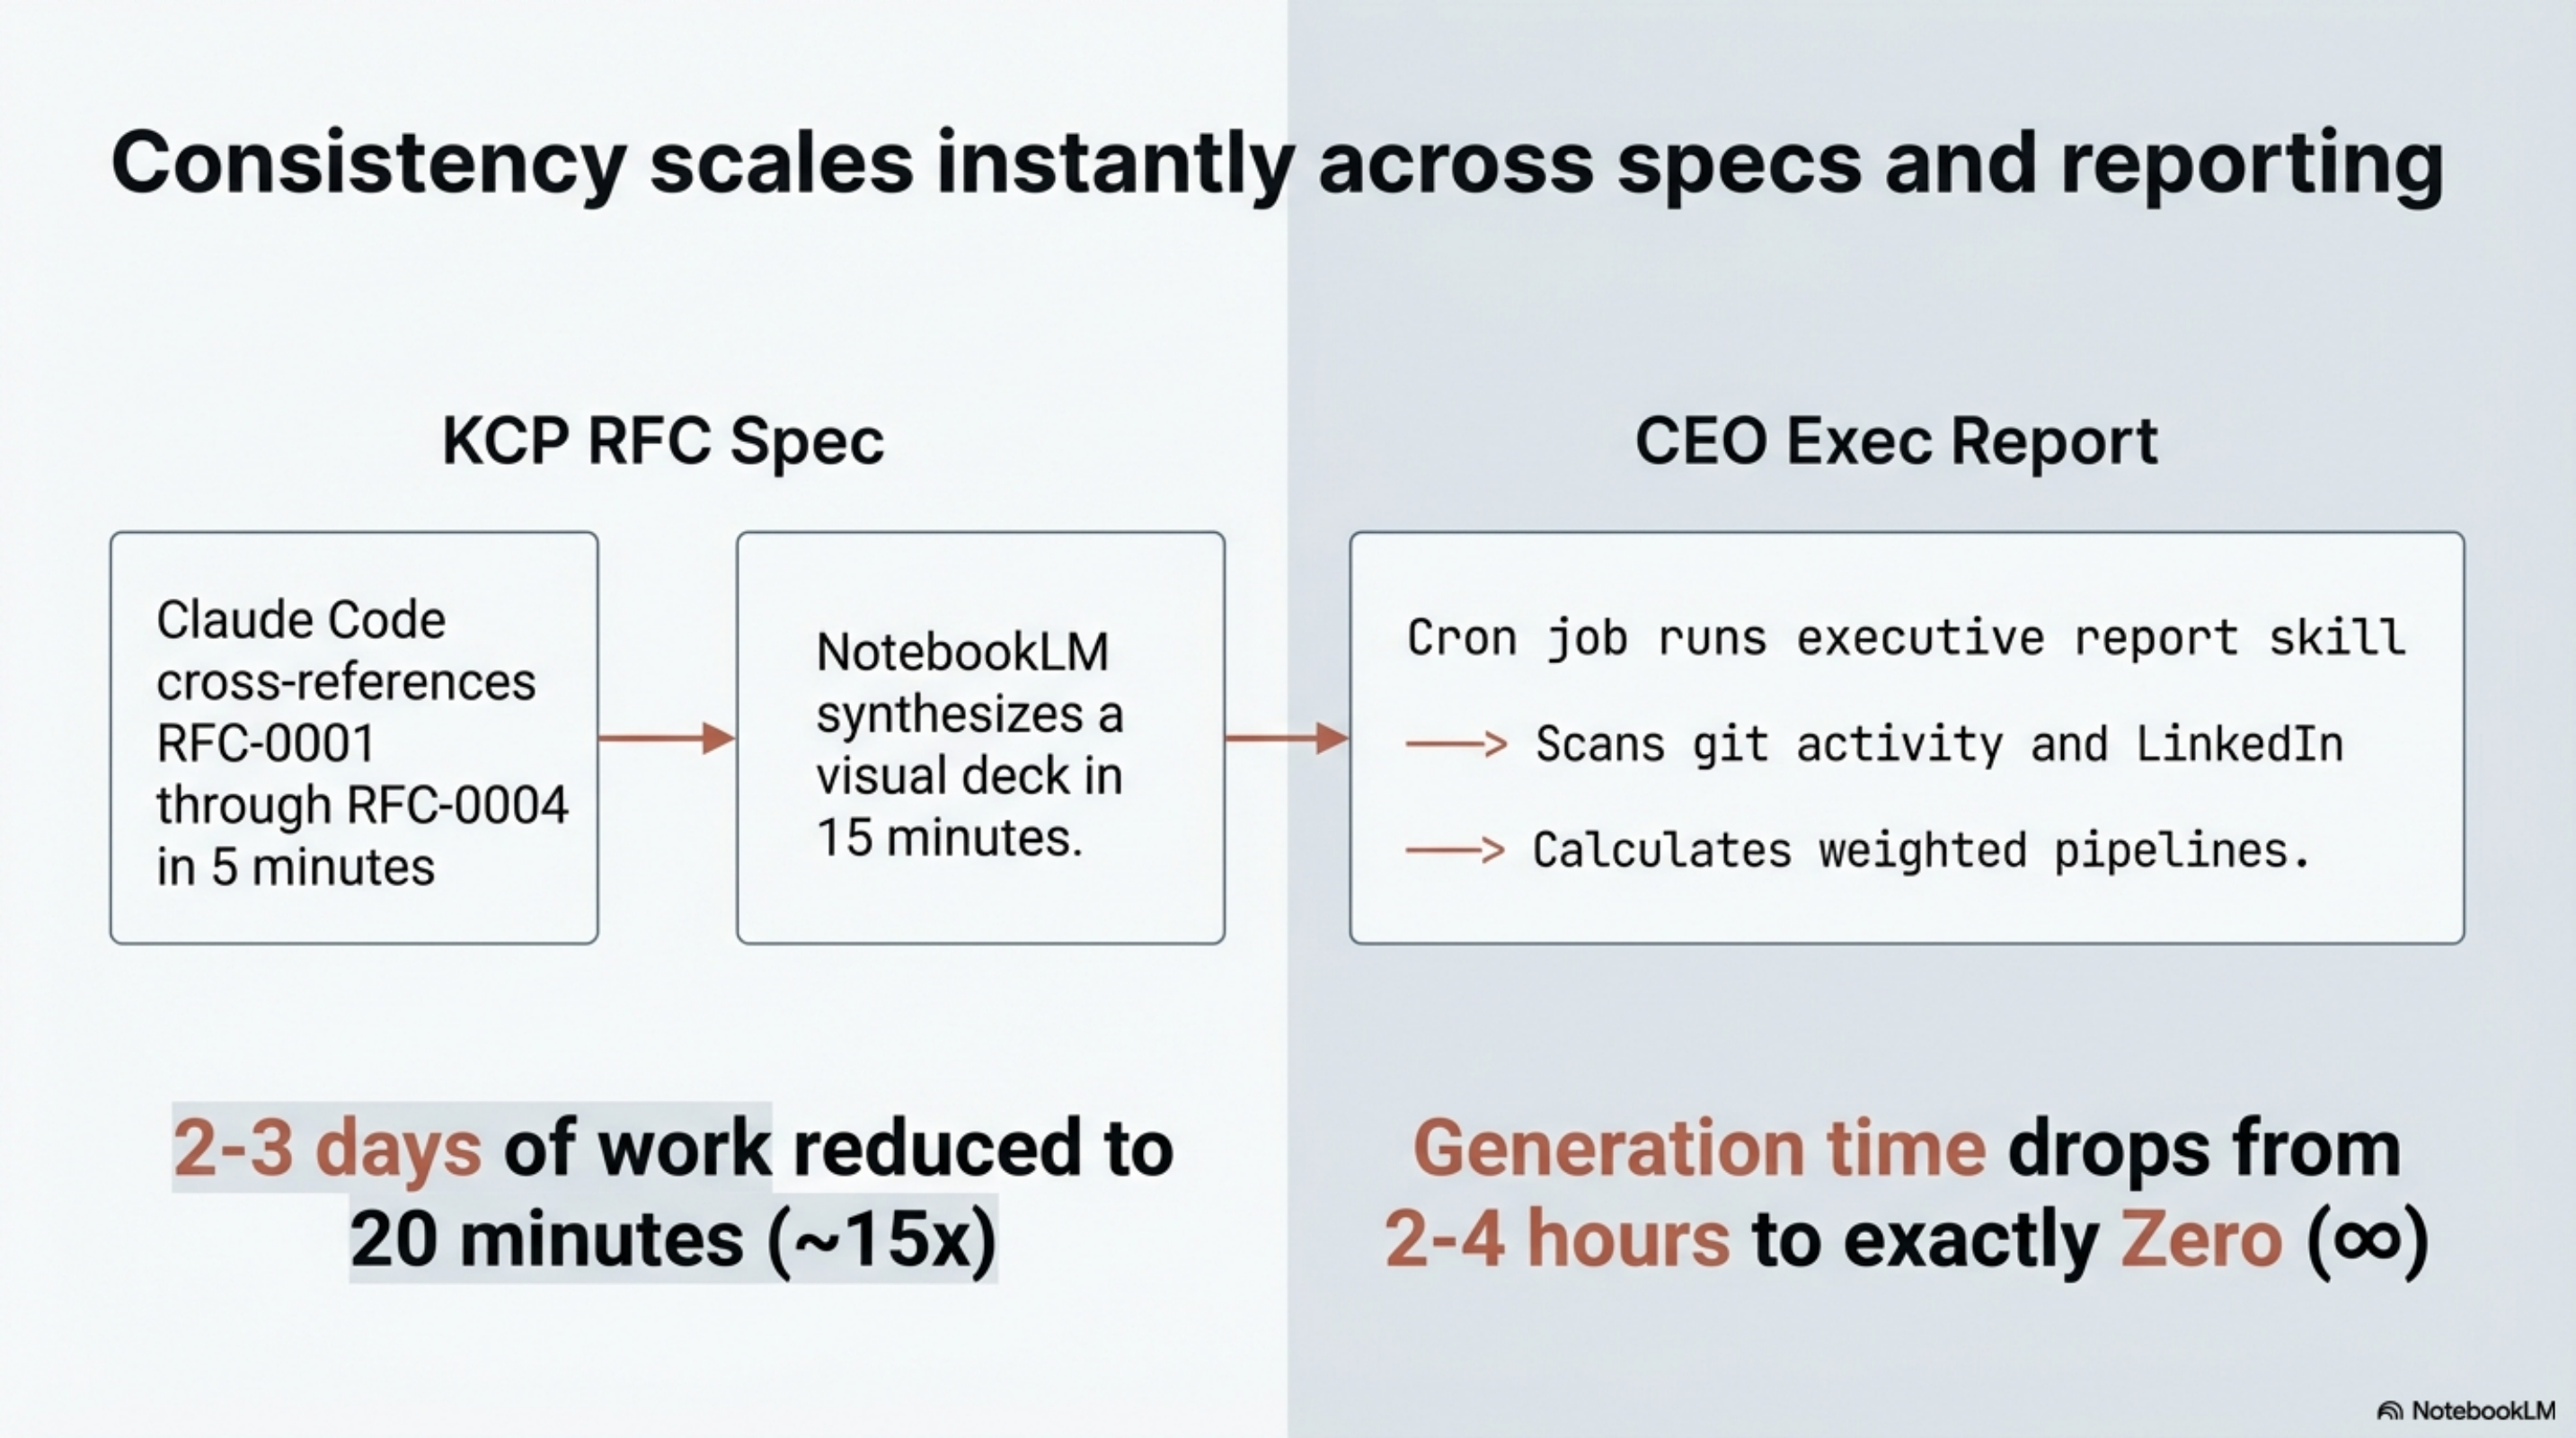
14:45 — KCP RFC
The Knowledge Context Protocol needs a new RFC defining industry-specific compliance extension fields for regulated industries. The spec needs to be internally consistent with existing RFCs, cover the edge cases, and be clear enough that an implementer can act on it without questions.
Without the stack: Research similar standards, review existing spec for consistency, outline, draft, revise, circulate. A standards document takes days.
With the stack: Two stages, both fast.
First, a ~5-minute Claude Code session: the KCP product skill loads the existing RFC conventions, Synthesis cross-references surface every related definition instantly, and Claude Code writes the full RFC draft with examples cross-checked against RFC-0001 through RFC-0004. What would have been hours of consistency review collapses to seconds.
Second, ~5–15 minutes in NotebookLM: upload the RFC, direct it to synthesise the compliance use cases and decision points. What comes back is a visual presentation — structured slides with key concepts, edge cases flagged, terminology aligned with the existing spec. The NotebookLM slides used throughout this article series came from exactly this workflow.
Total: 10–20 minutes for a written RFC plus a visual deck ready to share with implementers.
~15×. Spec writing is a domain where consistency matters more than speed. The value is not writing the words faster — it is that cross-document consistency is verified in seconds, and the second output (the visual presentation) is essentially free.
16:00 — CEO executive report
Weekly update covering business development and technical delivery across four companies. It needs to be scannable in five to seven minutes, quantified, and clear about what decisions she needs to make.
Without the stack: Scan emails, git logs, meeting notes, pipeline status, LinkedIn stats. Synthesize into a coherent narrative. Format. Two to four hours.
With the stack: The report generates itself. A cron job runs the executive report skill on schedule — Synthesis scans git activity, pipeline status, and the LinkedIn index; the skill calculates weighted pipeline values and structures the output: key wins, decisions needed, pipeline status, development activity, strategic insights. The file is waiting before I check my messages. Human time: zero generation, 3–5 minutes reading.
Essentially ∞. The task goes from something I do to something I read. And because the format is consistent week to week, the CEO can scan it in a pattern she already recognises — the structure itself carries information.
The Day in Summary
| Task | Without stack | With stack | Multiple |
|---|---|---|---|
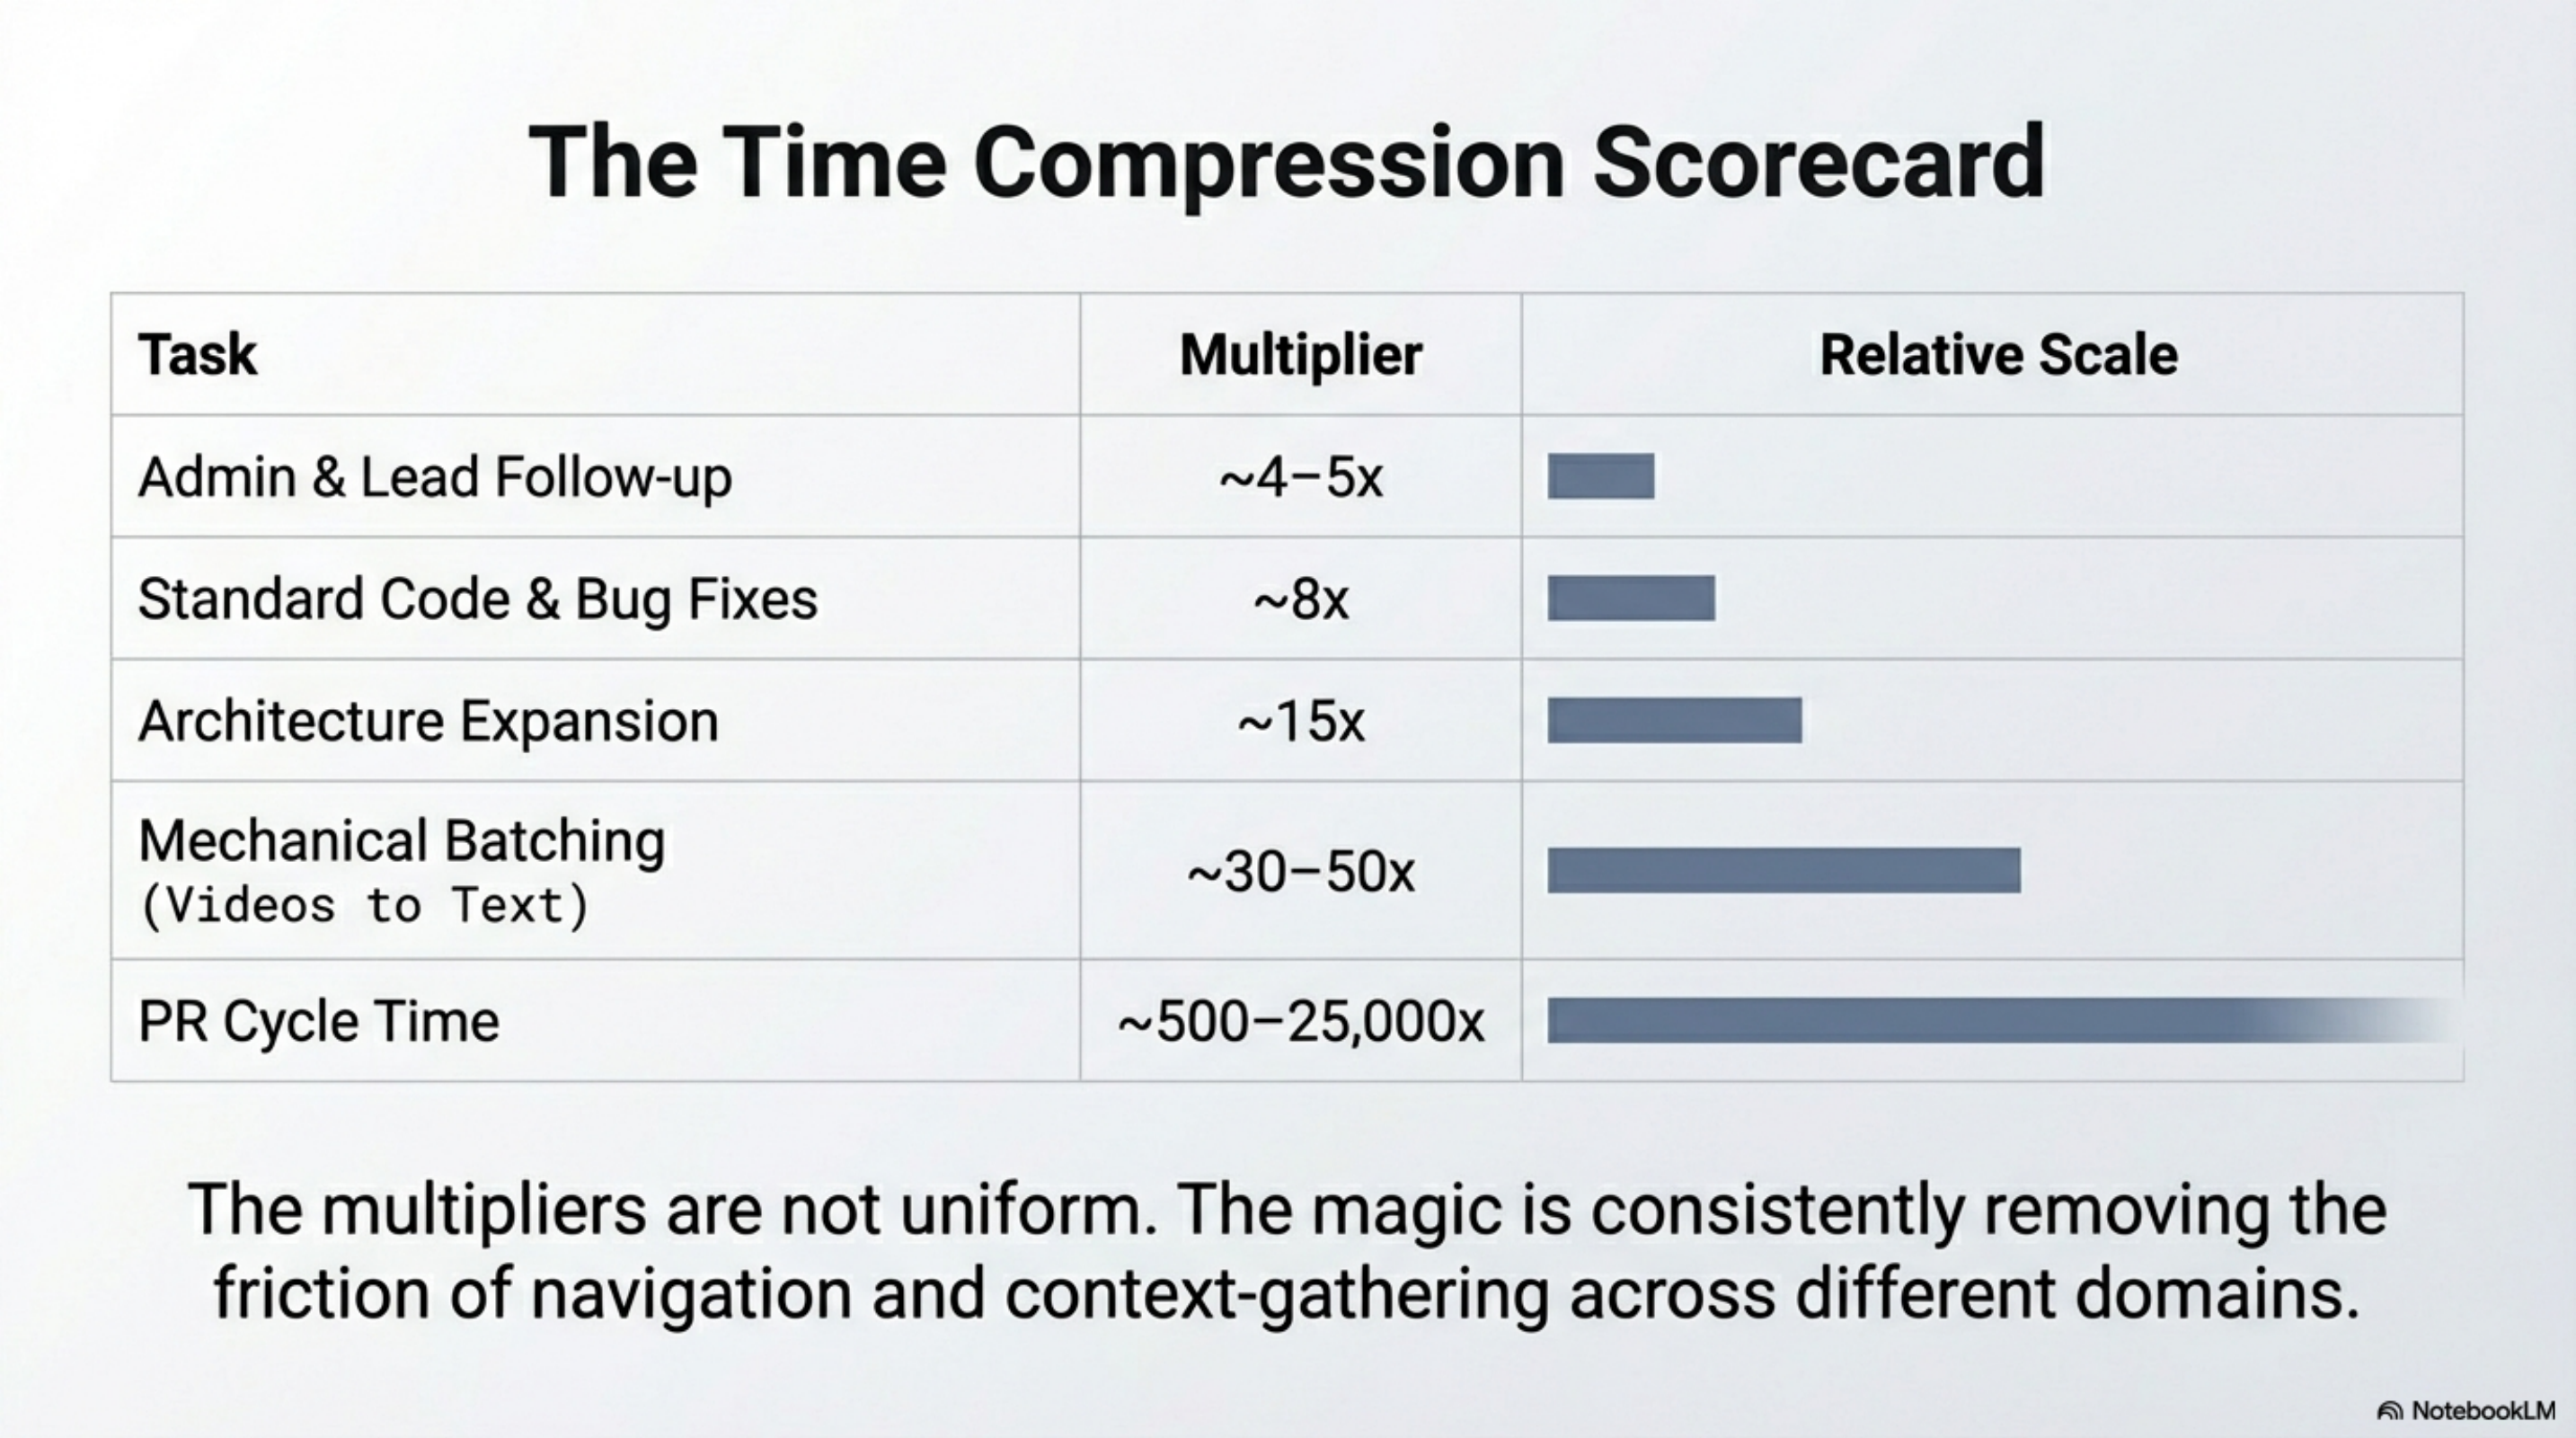
| Morning orientation + security triage | 30–40 min | 3 min | ~10× |
| Admin (lead follow-up + LinkedIn) | 75–120 min | 20–25 min | ~4–5× |
| Synthesis: 2 crash bugs (#255, #258) | 2–3 hours | 5–10 min each | ~8× |
| Synthesis: security false positives (#242) | 60–90 min | 5–10 min | ~8× |
| Synthesis: MCP expansion (#265, #266, #274) | 1–2 days | ~35 min core + small tuning pass | ~15× |
| PR cycle time (create → merge) | 1–5 days (industry avg) | 17–256 seconds | ~500–25,000× |
| Cantara dep maintenance (Renovate + Klaw) | ongoing manual | automated | ∞ |
| 38 videos → 78 blog posts | 5–10 weeks | 6–8 hours background | ~30–50× |
| KCP RFC + NotebookLM visual | 2–3 days | 5 min CC + 5–15 min NLM | ~15× |
| CEO executive report | 2–4 hours | automated (cron) | ∞ |
Compressed to a single Tuesday: what would have consumed 15–25 hours of linear work fits into under 2 hours of active development plus a batch pipeline running in the background. And this was a quiet day — the preceding two weeks averaged 4–10× this output per active day.
The honest framing: these multipliers are not uniform. The magic is not any single number — it is consistently removing the friction of navigation and context-gathering across every domain.
The Cache Math
One number from the infrastructure deserves its own paragraph.
| Token type | Volume |
|---|---|
| Cache read | 17.2 billion |
| Cache write | 844 million |
| Direct input | 11.3 million |
| Output | 11.0 million |
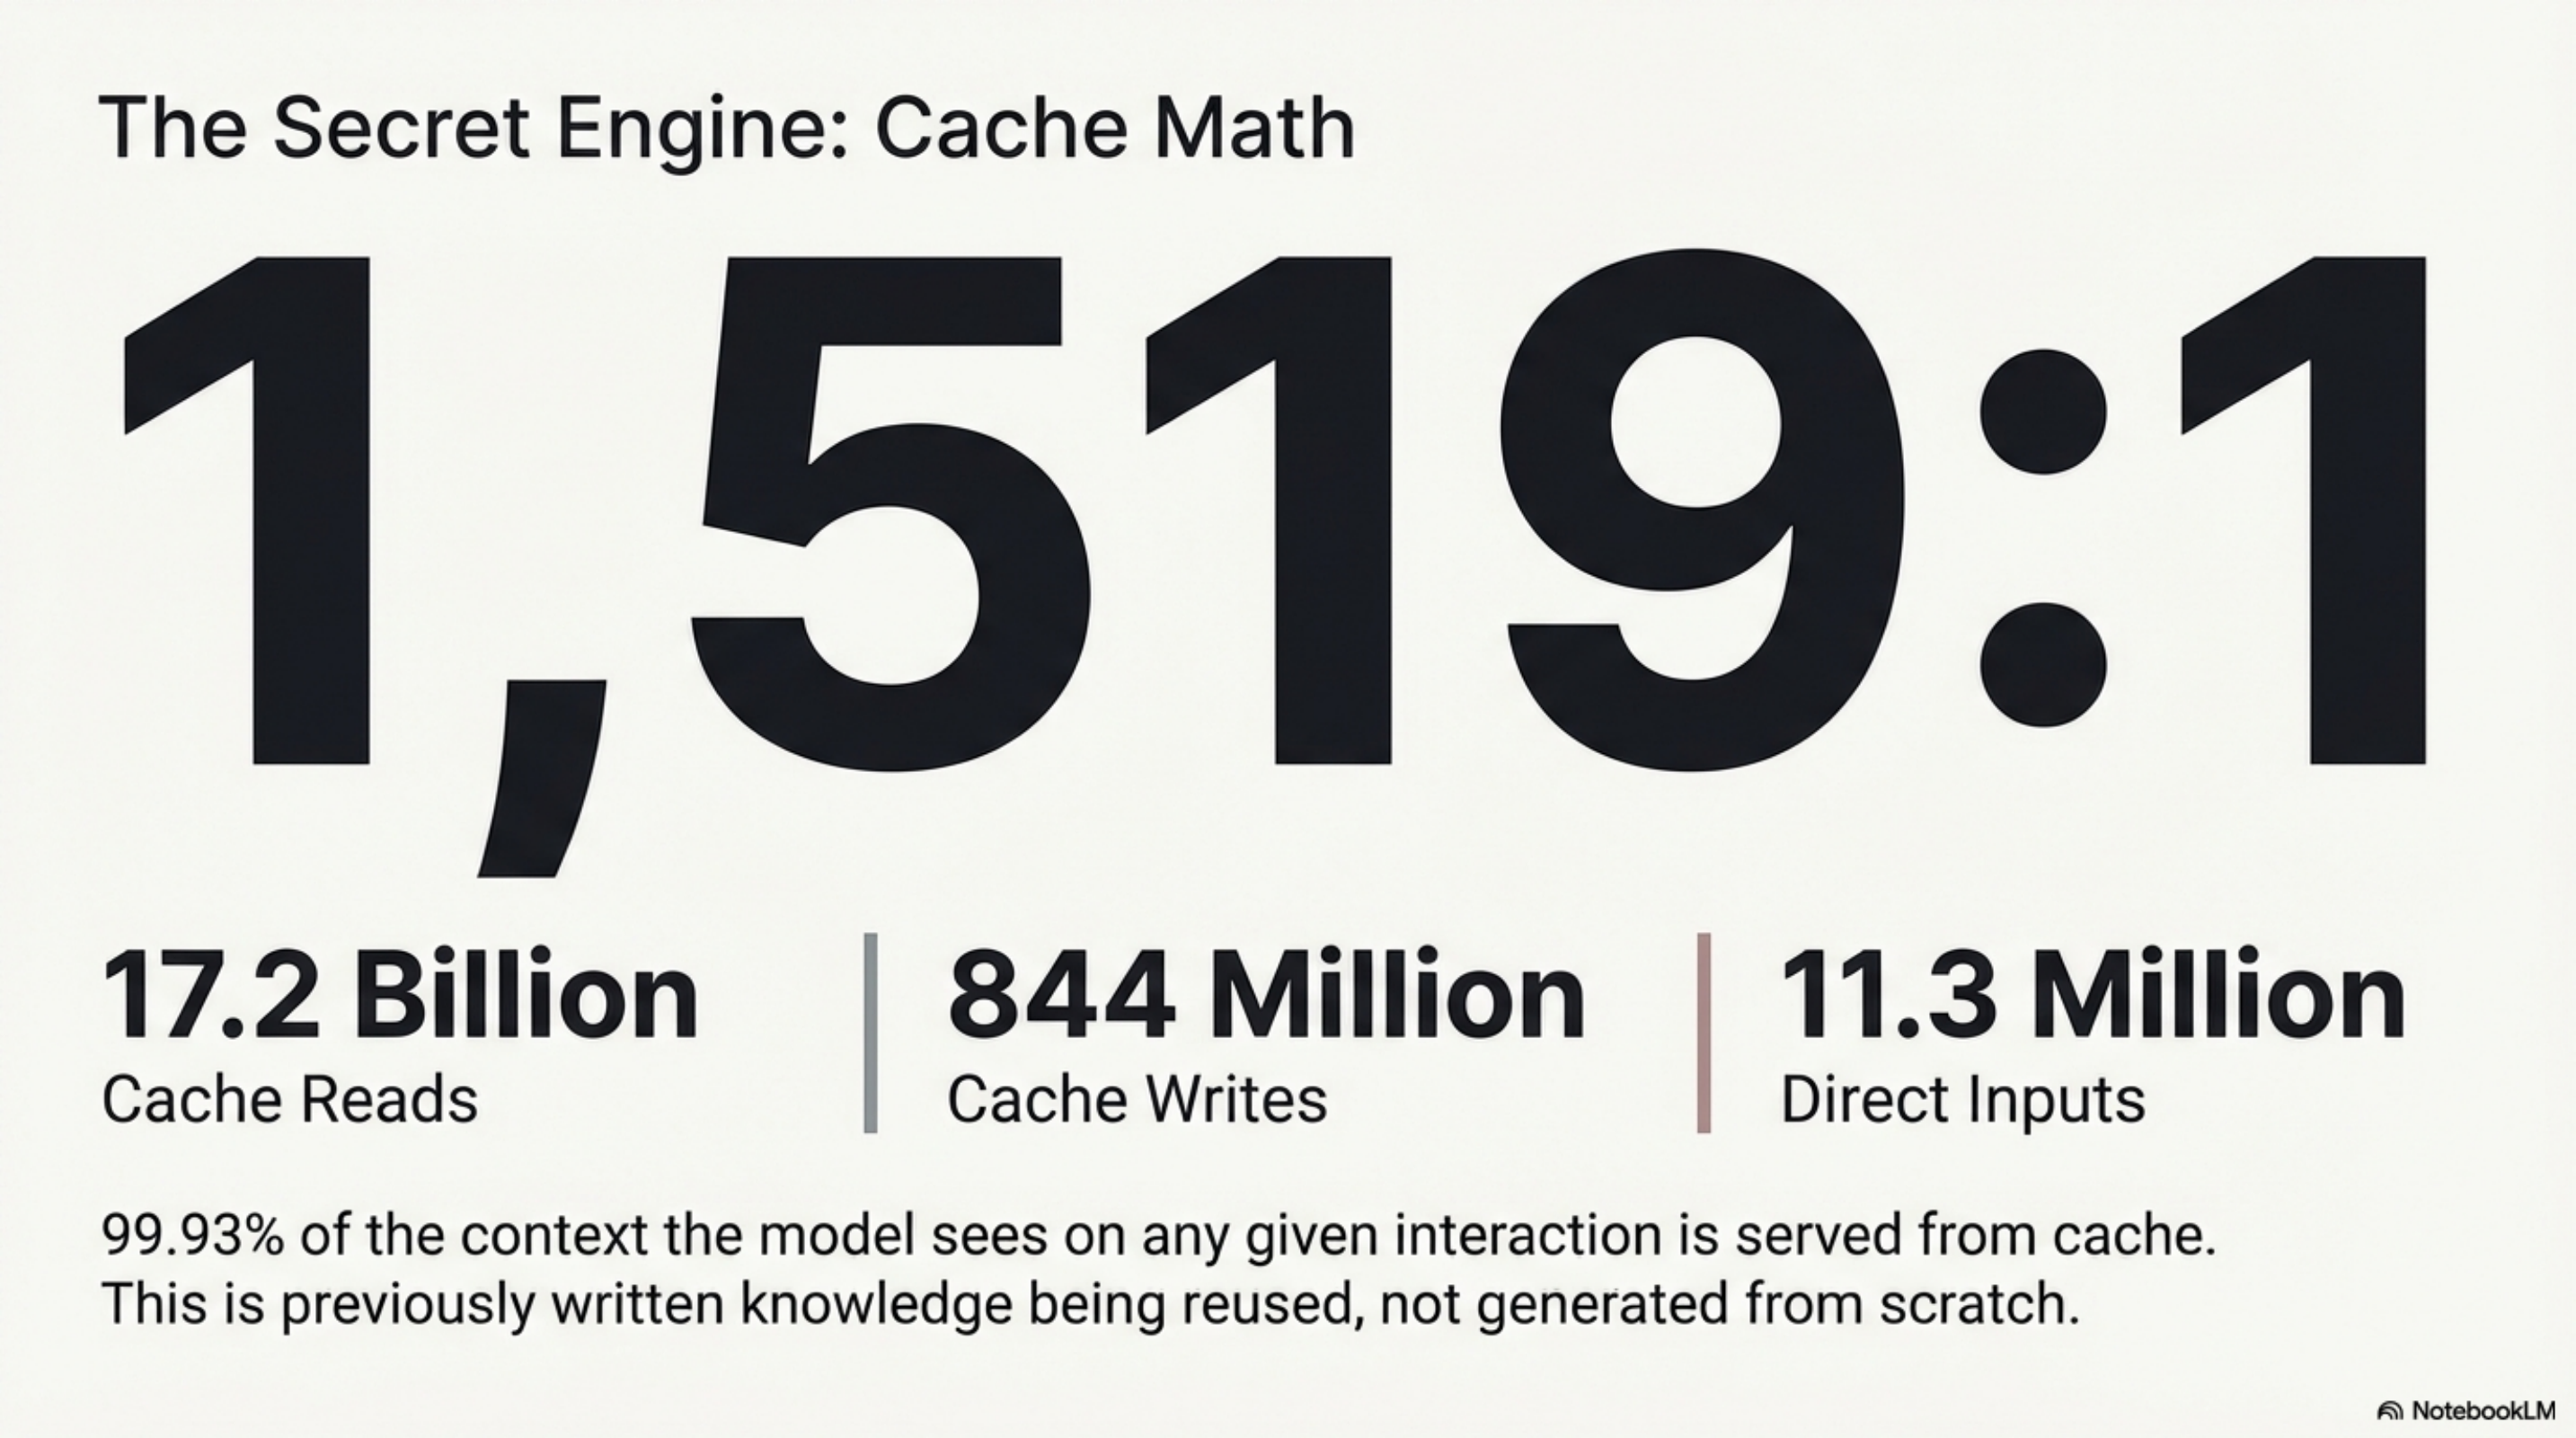
The ratio of cache reads to direct input is 1,519:1. That means 99.93% of the context the model sees on any given interaction is served from cache — previously written knowledge being reused. Every skill file is written once and amortised across hundreds of invocations.
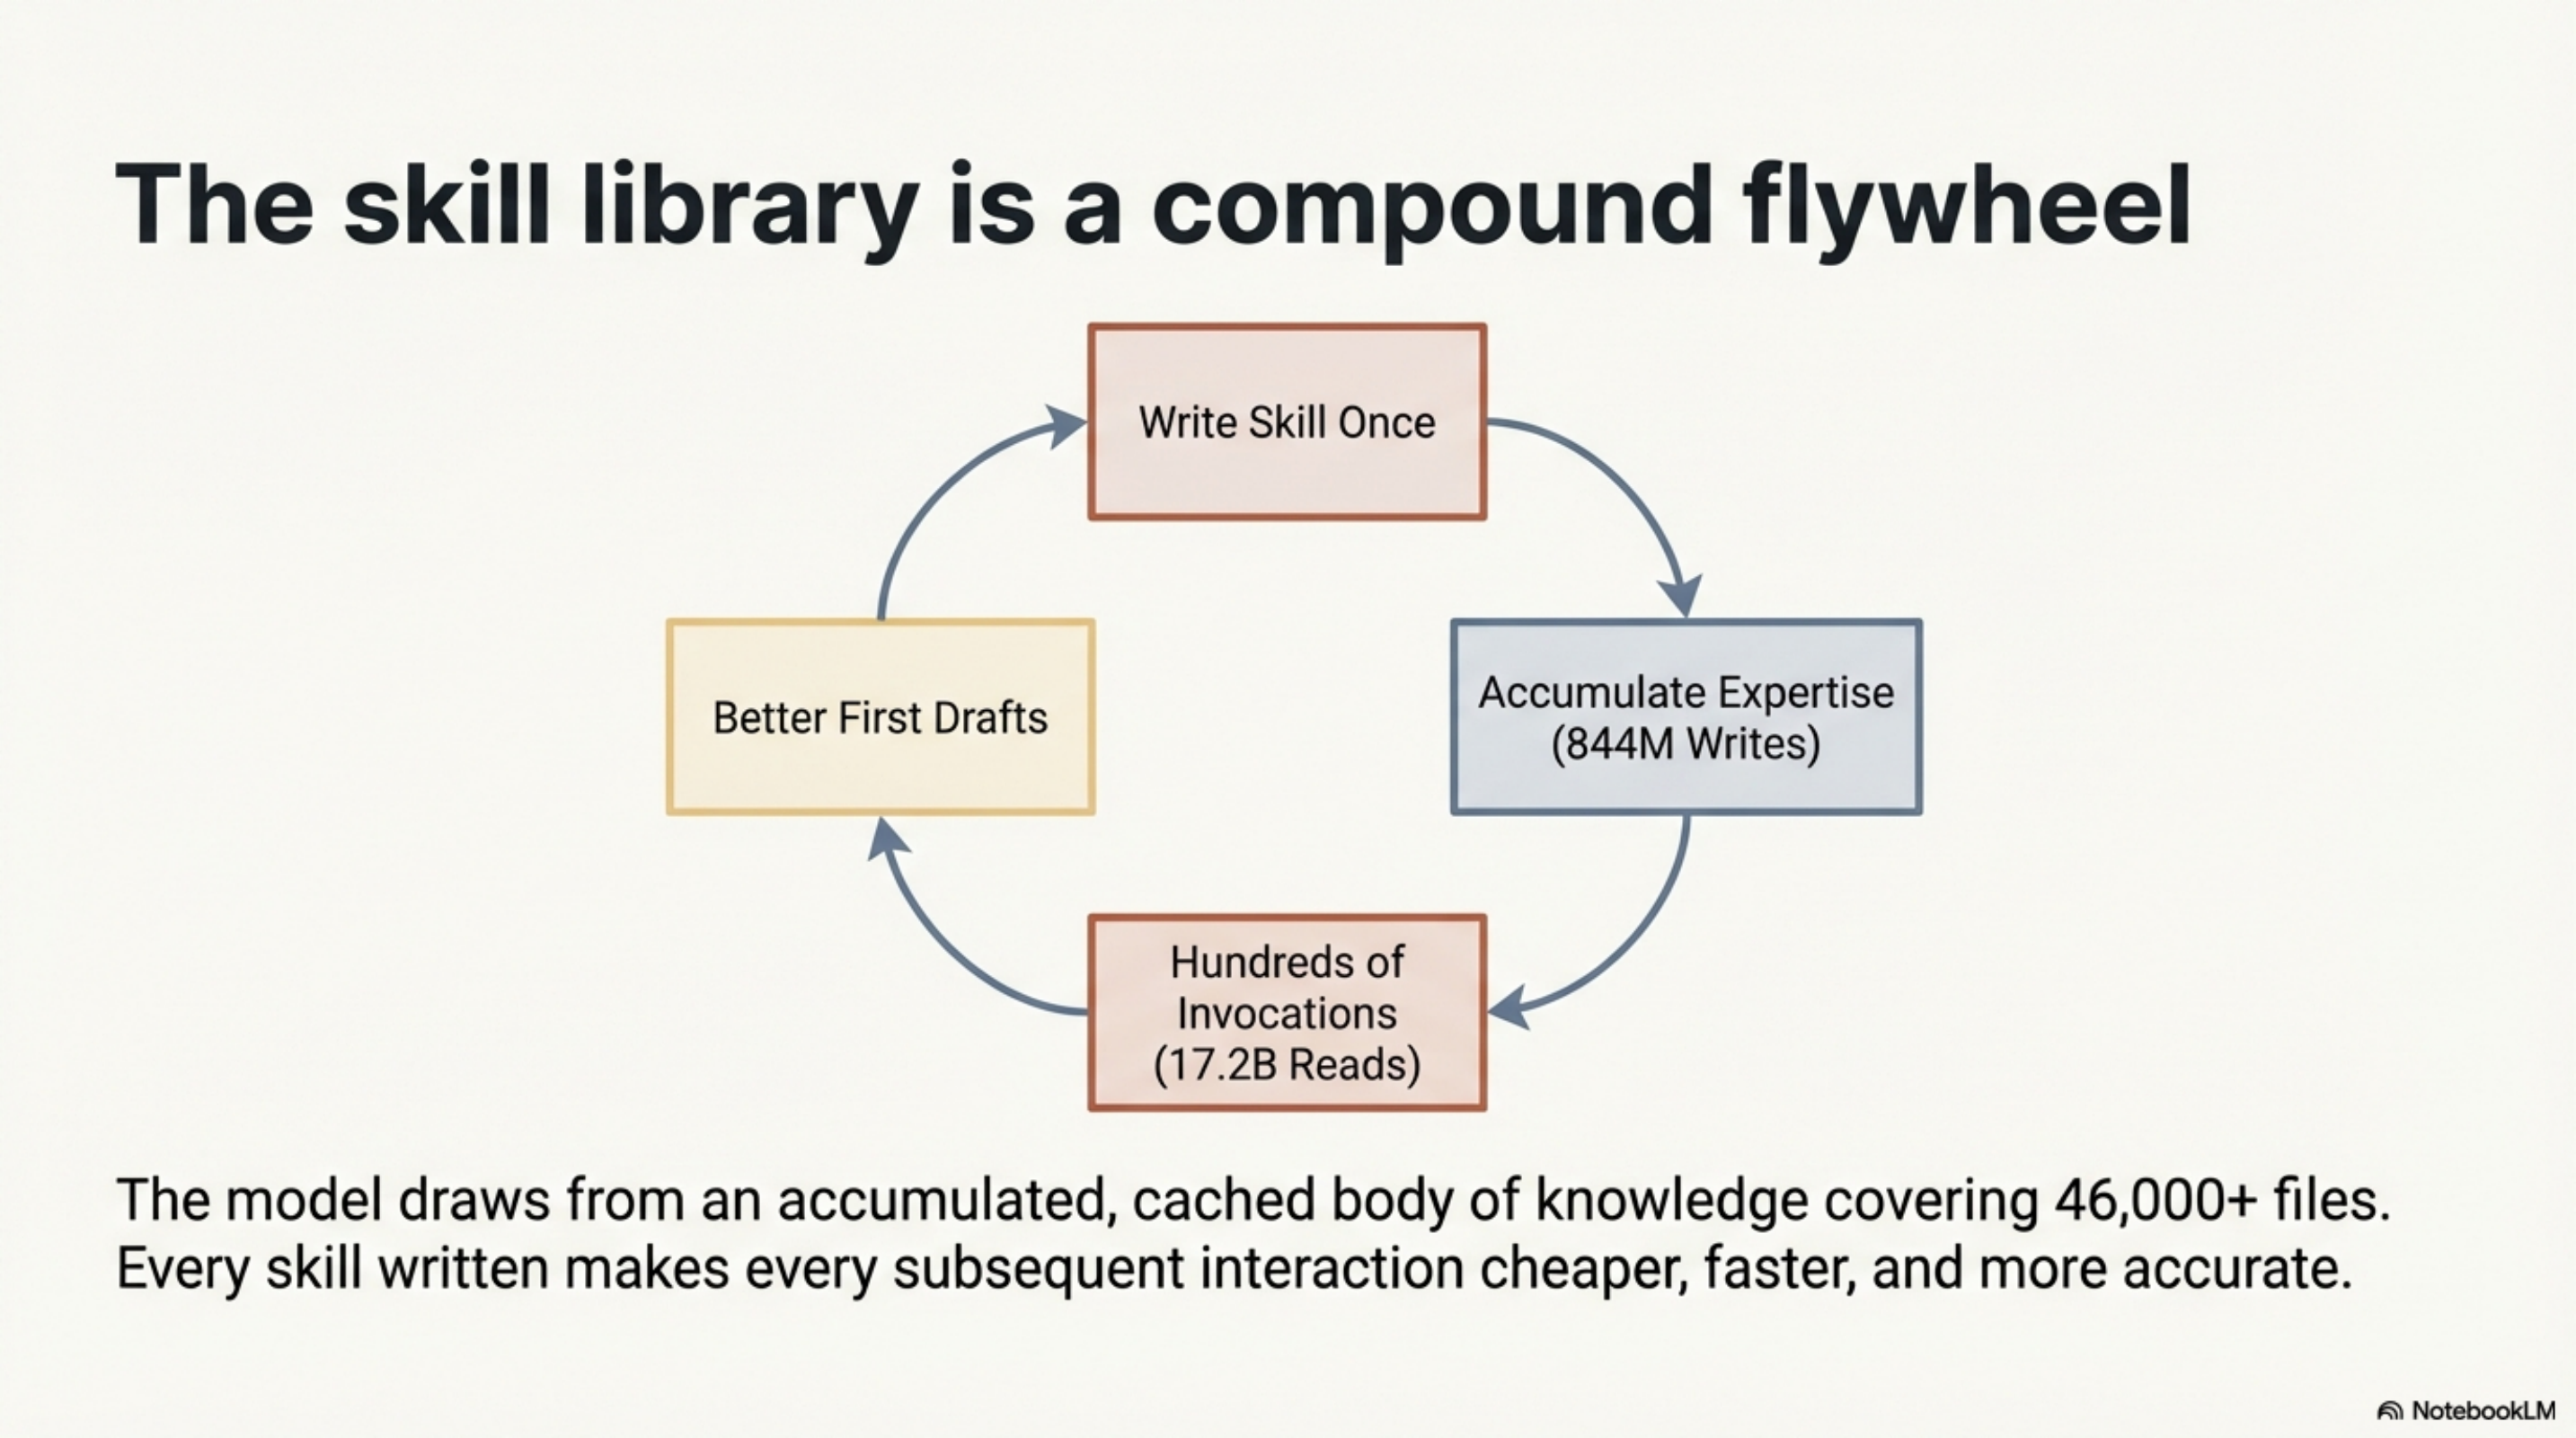
The 844 million cache-write tokens represent the total volume of accumulated expertise. The 17.2 billion cache-read tokens represent how many times that expertise was reused. The skill library is a flywheel: every skill written makes every subsequent interaction cheaper and better.
What the Day Does Not Show
Every system that saves time also costs time to maintain. The table above shows the stack at its best. Here is the other side.
Skills go stale. I updated a core library convention three weeks ago and did not propagate it to the relevant skill. Two sessions later, Claude Code generated code in the old pattern. I did not catch it during review. It shipped. The fix took twenty minutes; finding it took an hour. Stale skills are not just unhelpful — they are actively misleading.
Agents make mistakes. Klaw filed a CVE issue for a dependency in a commented-out POM block — a false positive that required a code fix to the security scanner and a manual close. The morning briefing failed one day because the Synthesis changelog contained ANSI escape codes that broke the context push script. The stuck-state bug in the agent framework means Mímir occasionally stops processing messages until its health check restarts it.
The nightly sync has a 24-hour lag. If I update memory at 3 PM, the agents do not see it until 2 AM. Hot changes require a manual push.
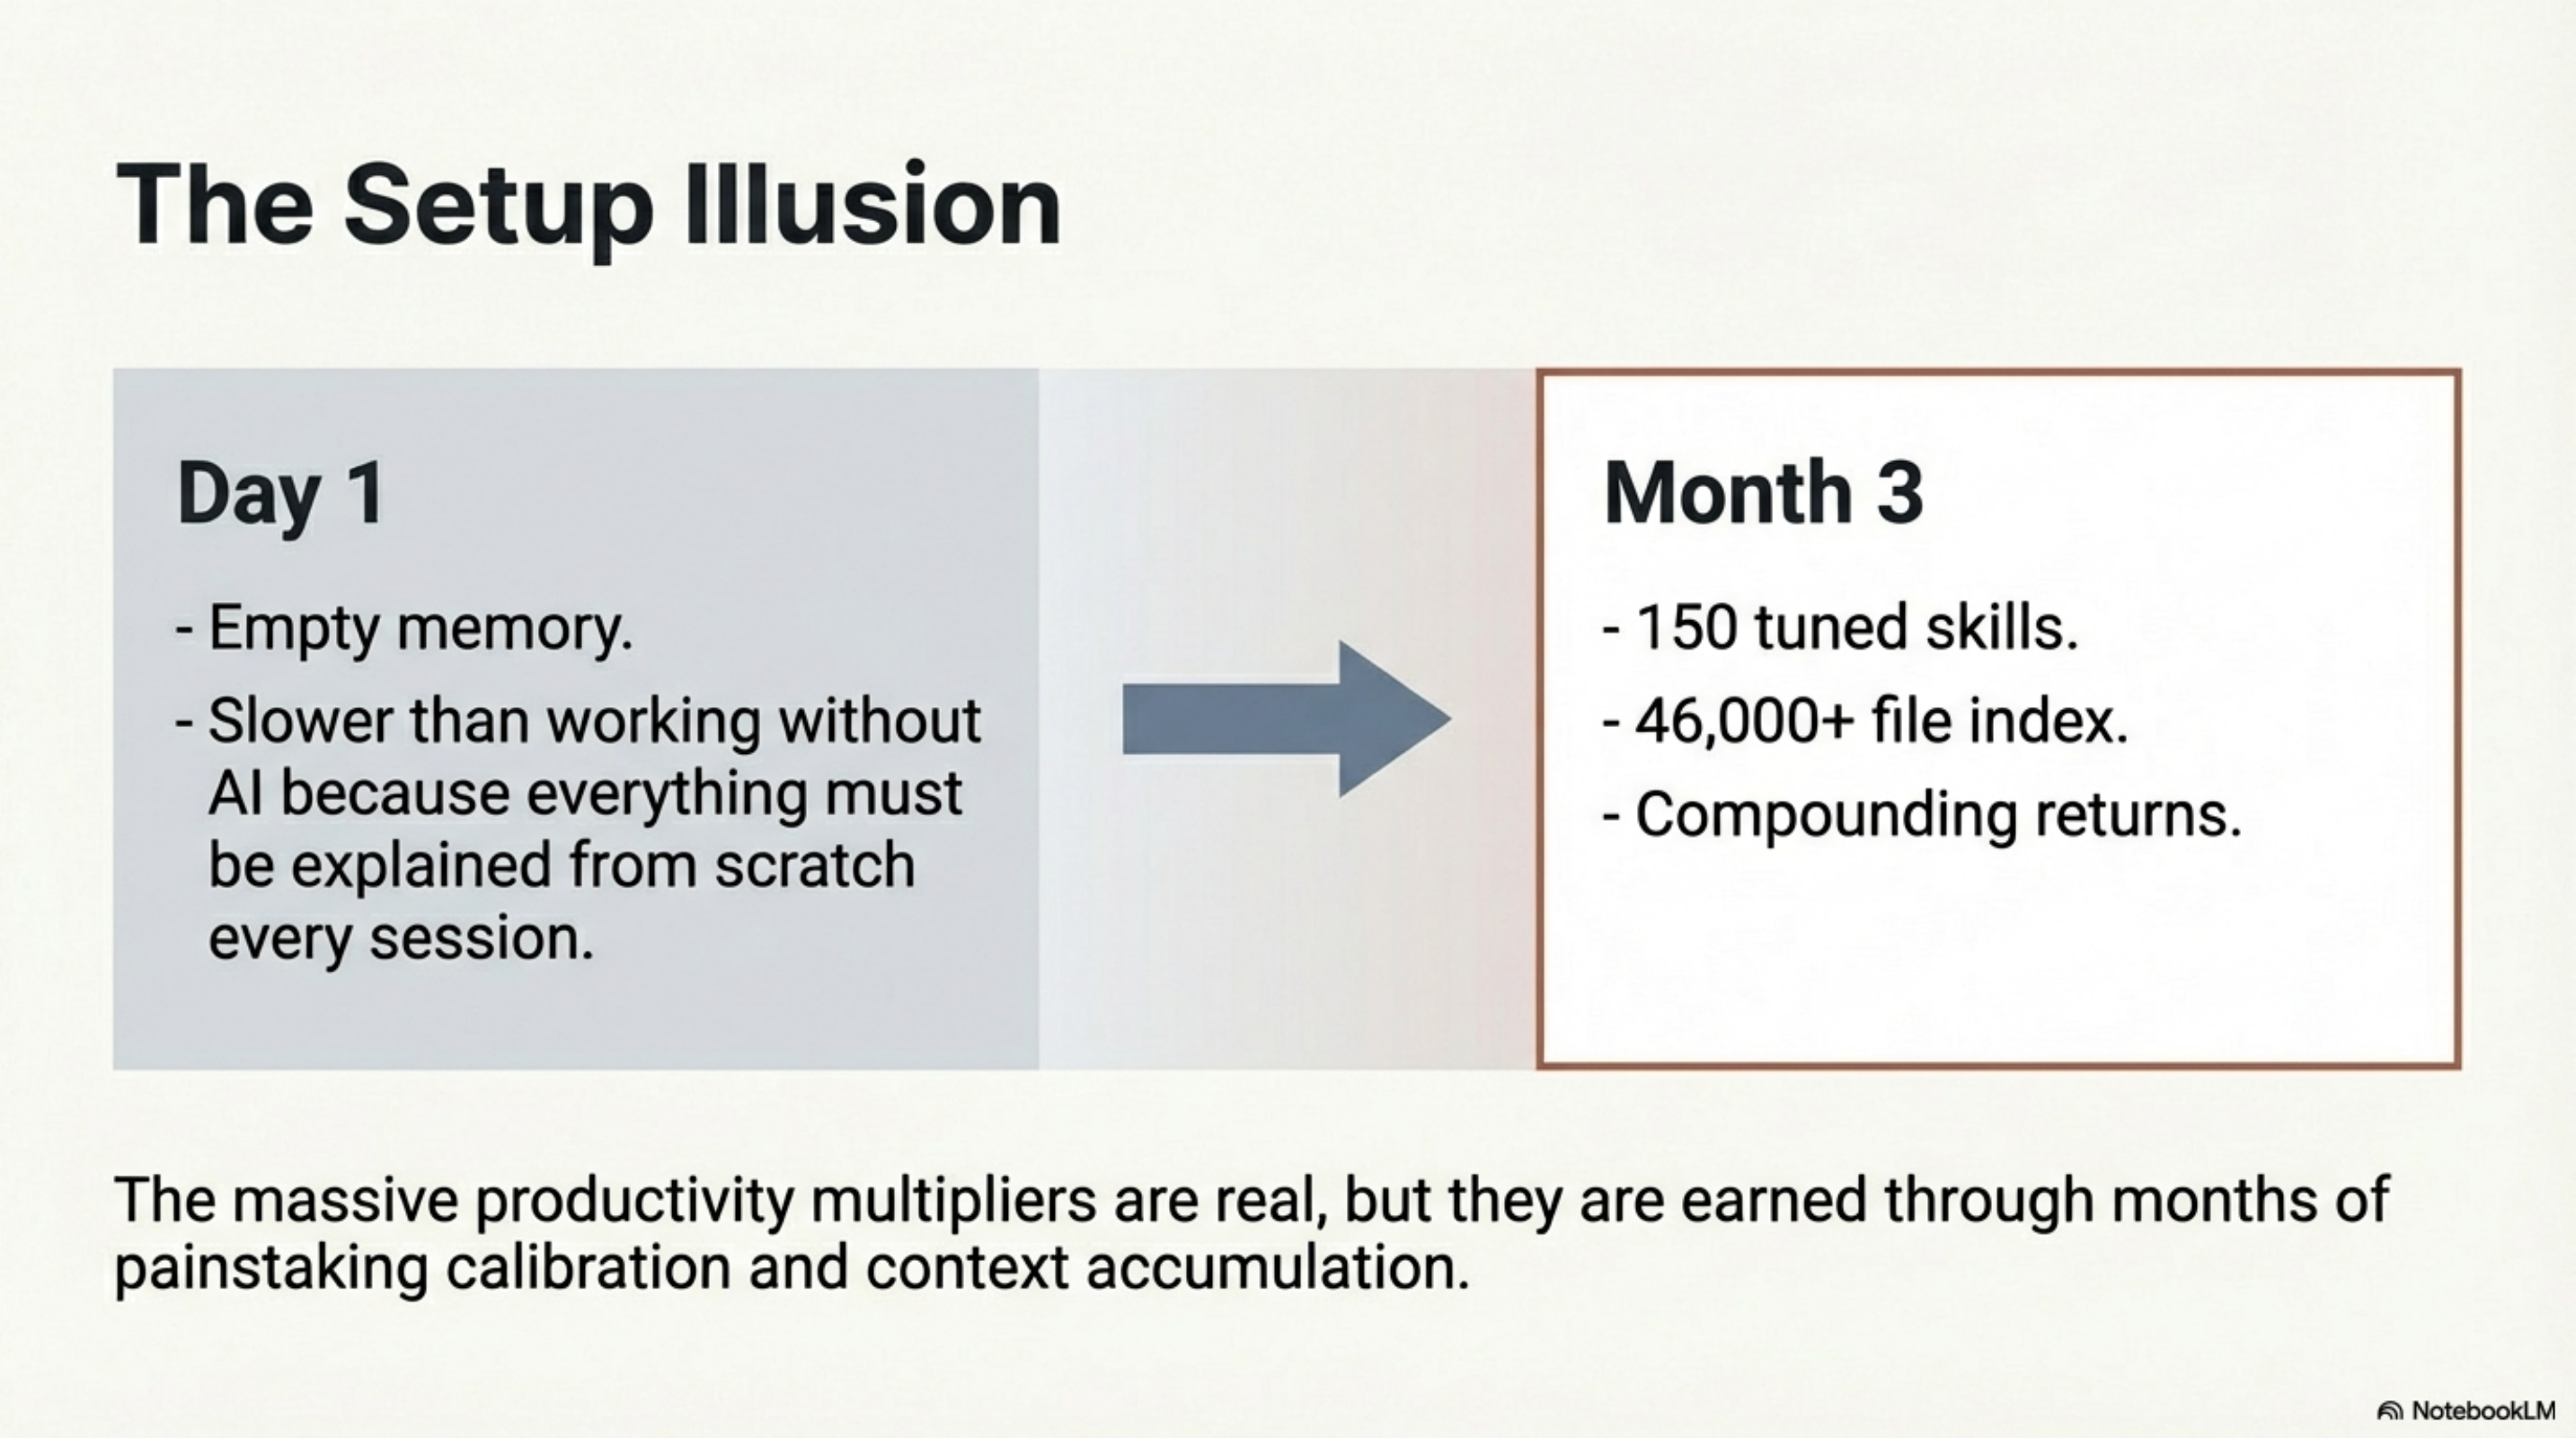
The setup was slow. The 150 skills did not exist on day one. The memory system was empty. The first month looked nothing like the productivity table above. The compound returns are real, but they are earned through months of accumulated context.
What I Would Tell Someone Starting
Start with one skill for your primary codebase. Not one hundred. One.
The skill should encode what you find yourself explaining to the model every session — the file layout, the testing conventions, the vocabulary, the things that are obvious to you but not to a fresh context. Write that down once. Watch the model stop asking the same questions.
Then do it again for the next most repeated explanation. Then again.
The rest — the agents, the automation, the nightly sync, the Synthesis MCP server — are refinements on top of the thing that actually shifts your daily experience. That thing is accumulated context. Everything else is infrastructure for managing and distributing it.
The Honest Close
The first Tuesday looked nothing like this.
The first Tuesday with Claude Code was slower than working without it in many cases, because I had to explain everything from scratch every session. The first month was the investment phase — writing skills, building memory, learning what to encode and what to leave implicit. The productivity table above reflects a system with months of accumulated context, 150 skills tuned to specific workflows, and a knowledge index that covers 46,000+ files.
That is the honest truth about compound productivity: the setup is slow, the payoff is not.
The 1,519:1 cache ratio is not a feature of the tool. It is the result of months of knowledge accumulation. The tool is the substrate. The knowledge is the asset. Anyone can install Claude Code. The accumulated context — that is what actually takes time to build.
Part 1: Four Layers: How I Built an AI Development Environment That Partly Runs Itself
Part 3: What It Looks Like from Inside the Stack — a first-person account from the AI running inside this environment.
Series: The Four-Layer AI Stack
← Four Layers: How I Built an AI Development Environment That Partly Runs Itself · Part 3 of 4 · What It Looks Like from Inside the Stack →