From Instrumentation to Infrastructure
AI agents like Claude Code run dozens of CLI commands per session, orchestrating complex multi-step workflows. Without structured knowledge of each tool, the agent guesses flags, calls --help to discover syntax, or retries when the first attempt fails. Each mistake compounds: a wrong flag in step 3 can invalidate everything that follows.
kcp-commands solves this with manifests -- YAML files that encode exactly what an agent needs to use a CLI tool correctly: key flags, preferred invocations, output patterns to strip. The daemon injects the right manifest before each Bash call, turning an uninformed first attempt into a guided one.
kcp-memory adds the second dimension: episodic memory. Every session is indexed. Every tool call is logged. The agent can search what it did last week, recover the reasoning from a delegated subagent, and see which manifests are actually working in practice.
Together they make Claude Code measurably smarter: 33% of the context window recovered, --help calls eliminated, and an agent that learns from its own history instead of starting from zero every session.
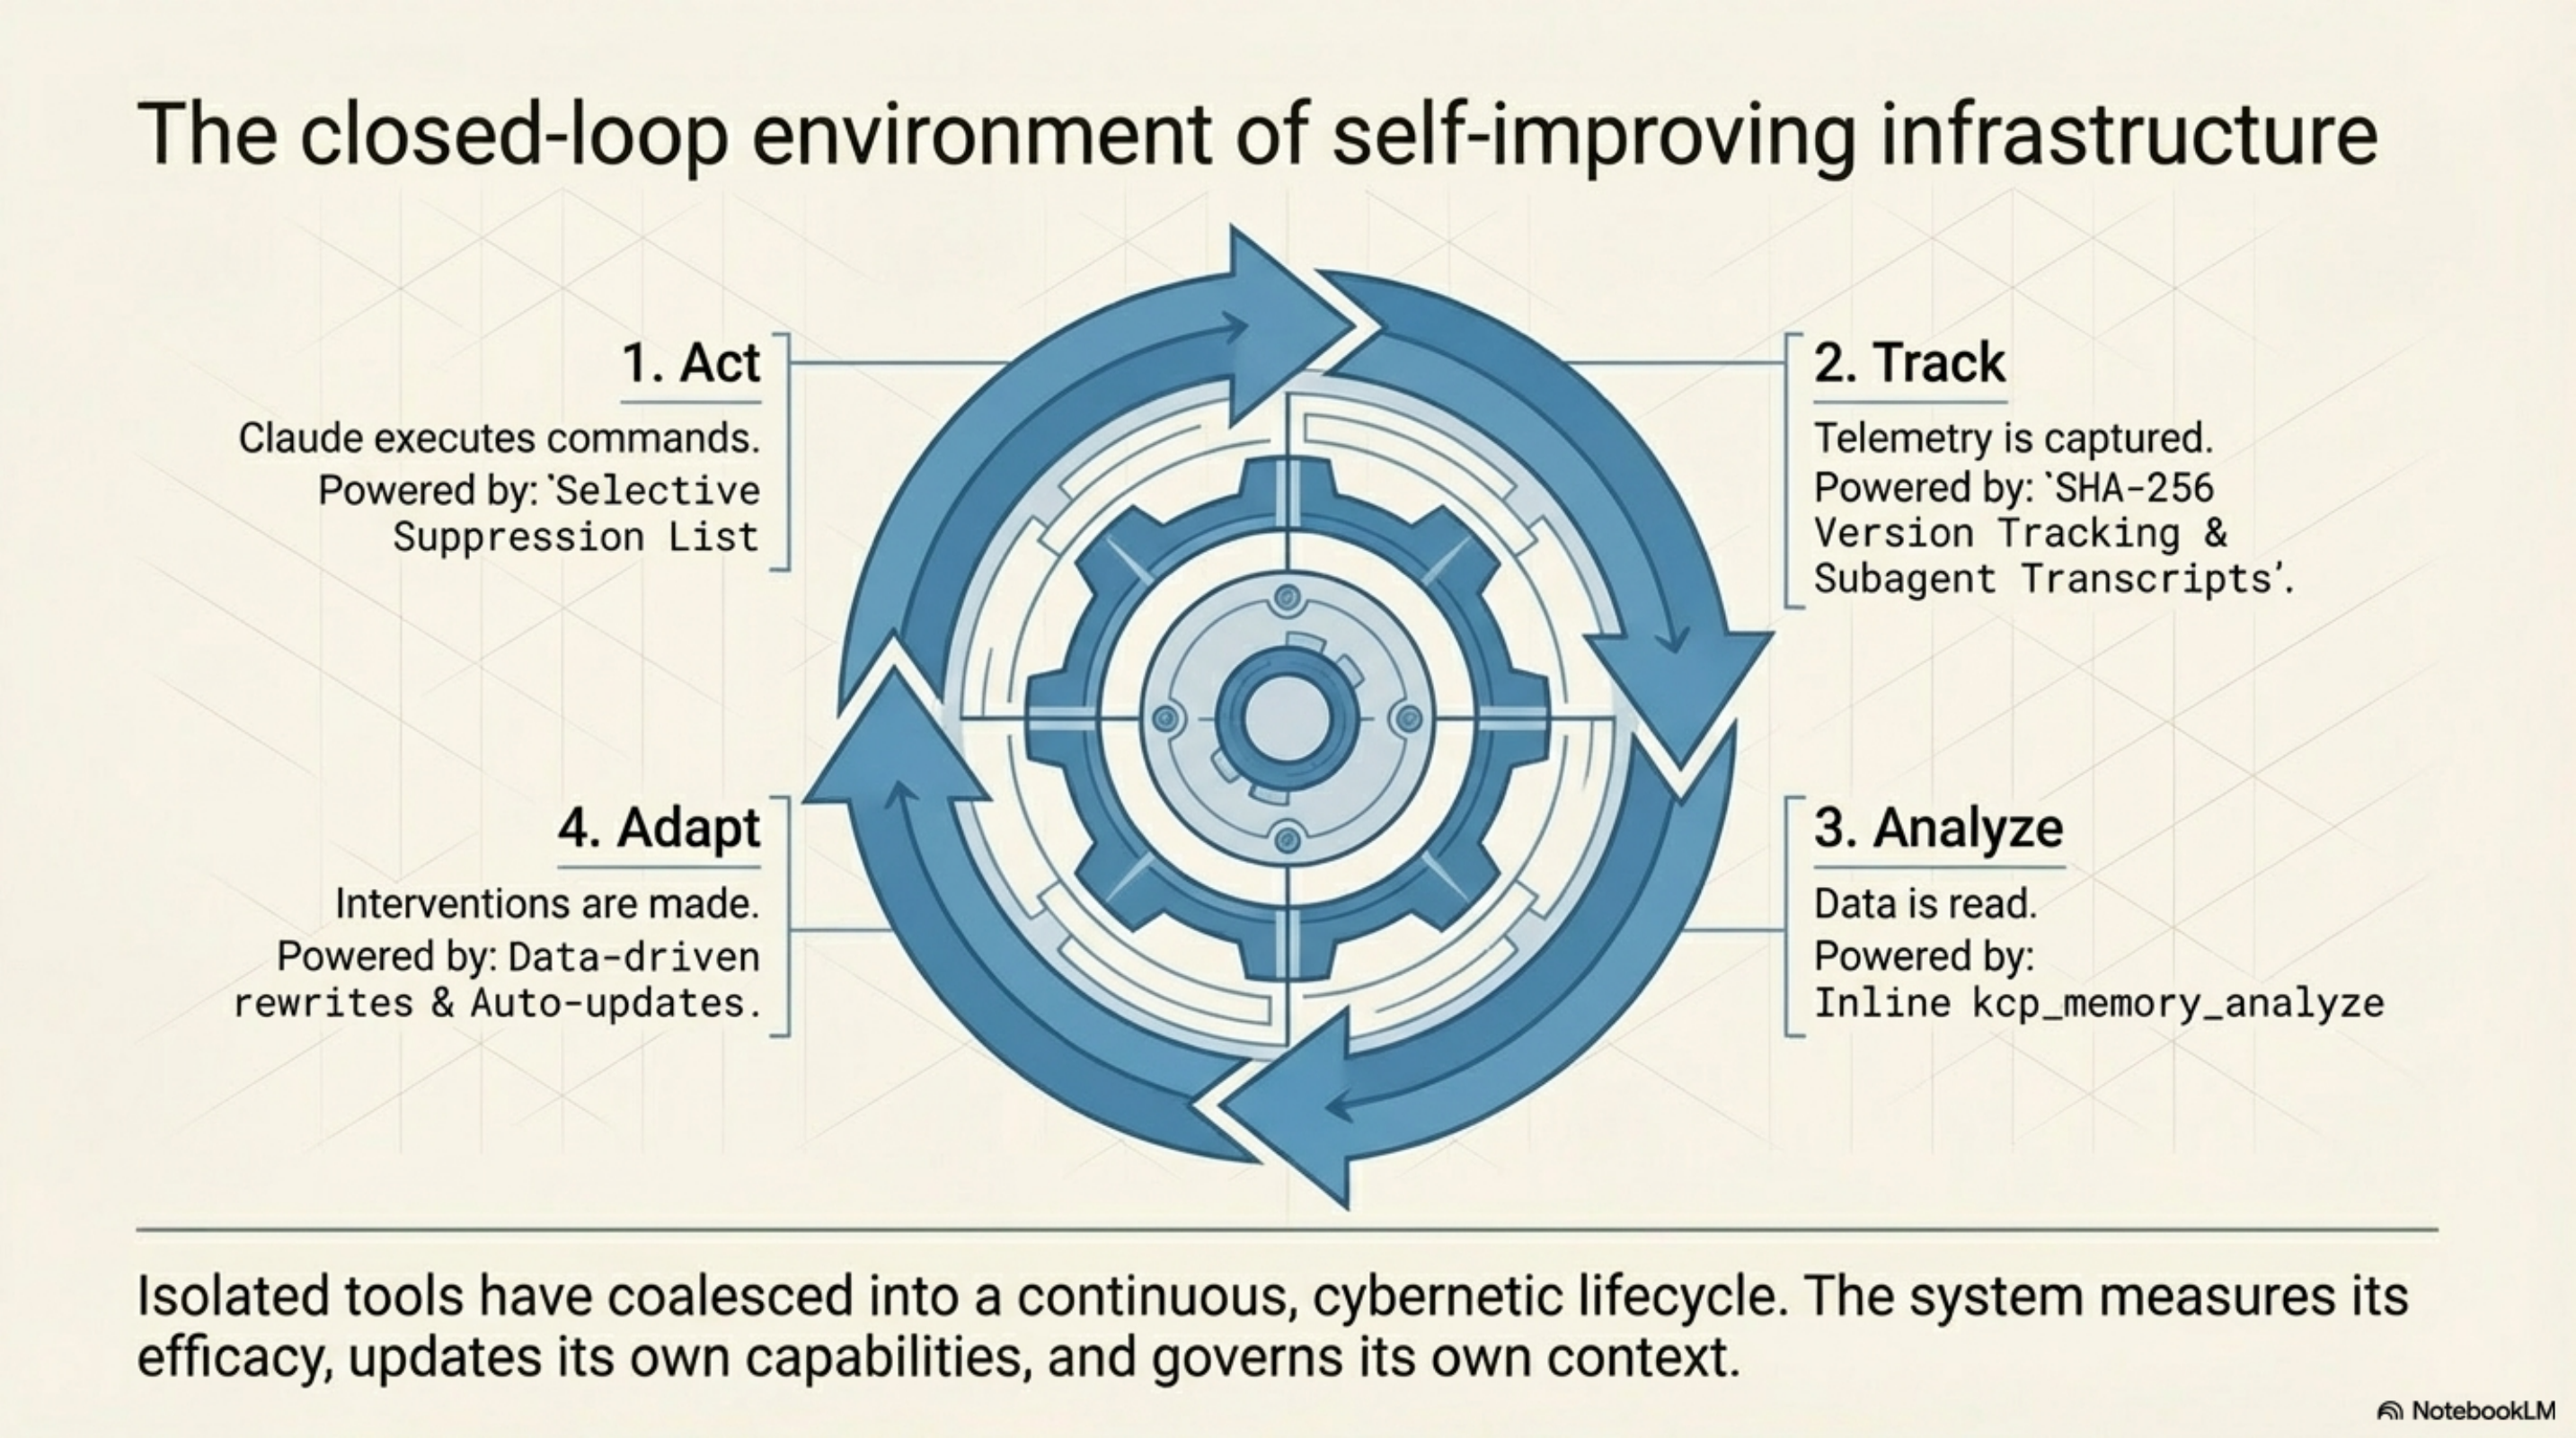
The latest addition closes the loop: the tools now learn from their own performance. Every Bash call produces an outcome signal. kcp-memory tracks retry rates, help-followup rates, and error rates per manifest -- surfacing which ones are guiding the agent well and which ones are steering it wrong. The highest-failure manifests have already been rewritten based on the data. The infrastructure measures its own effectiveness and improves.
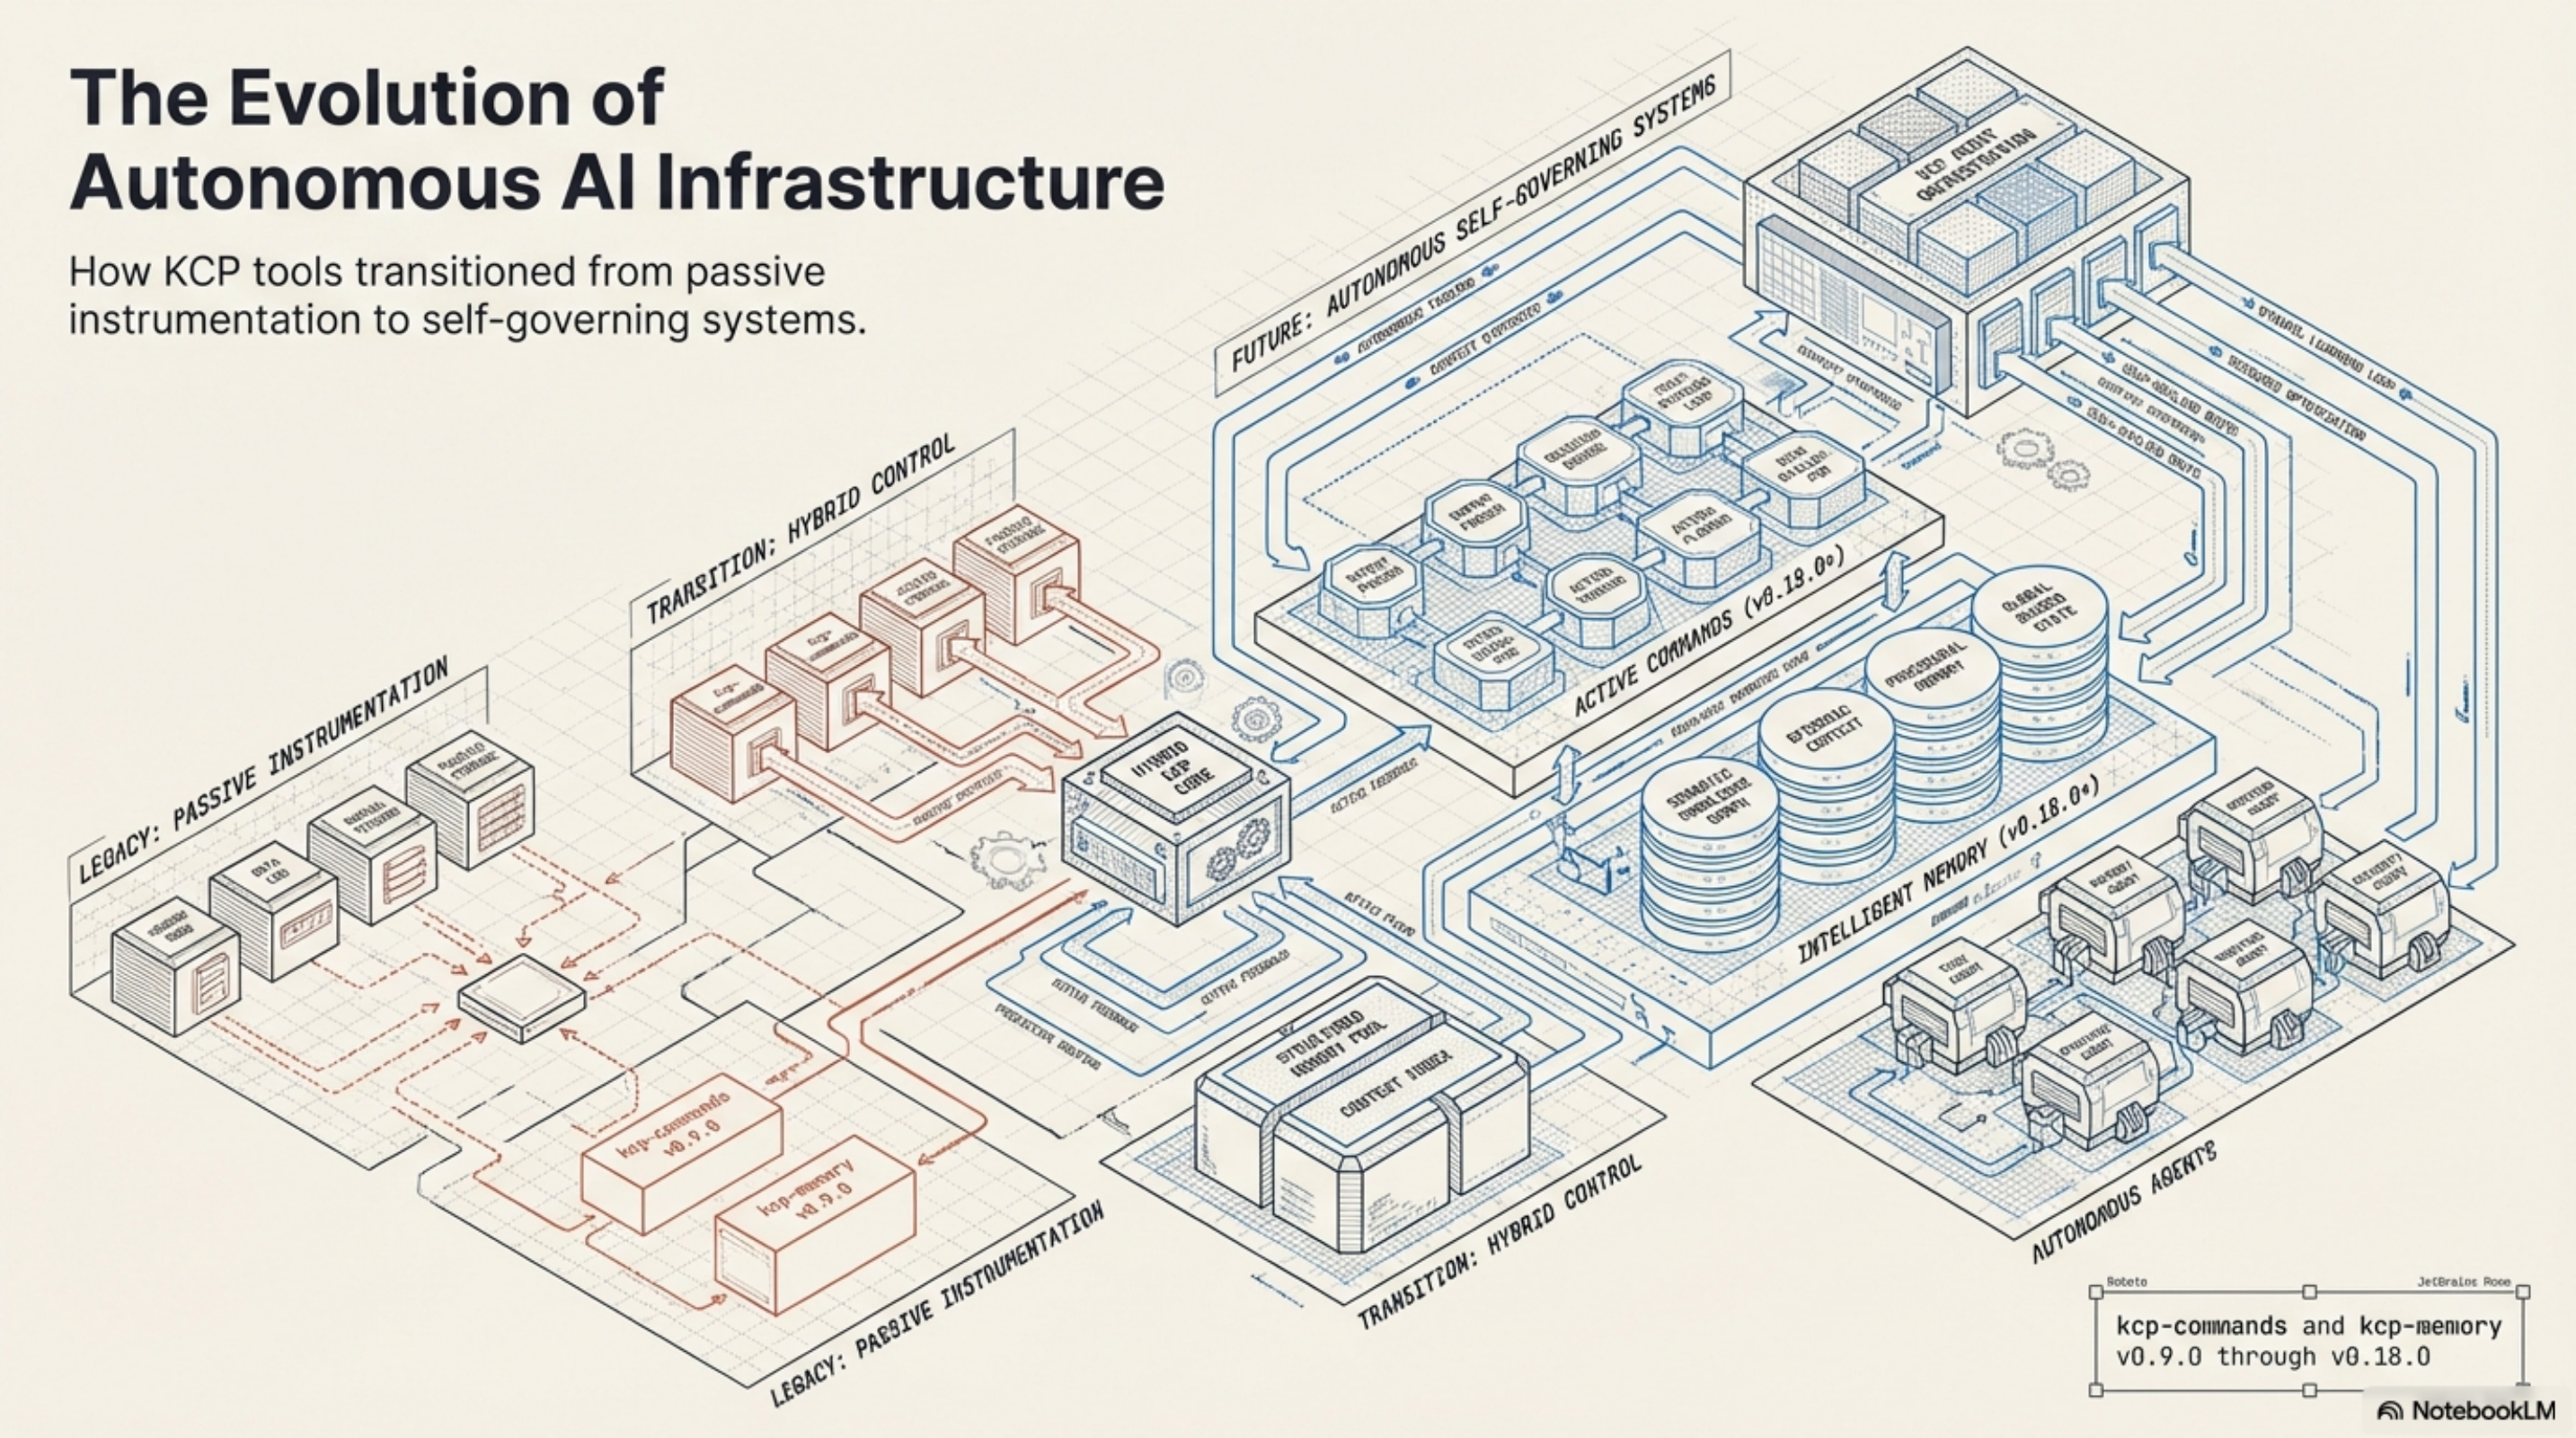
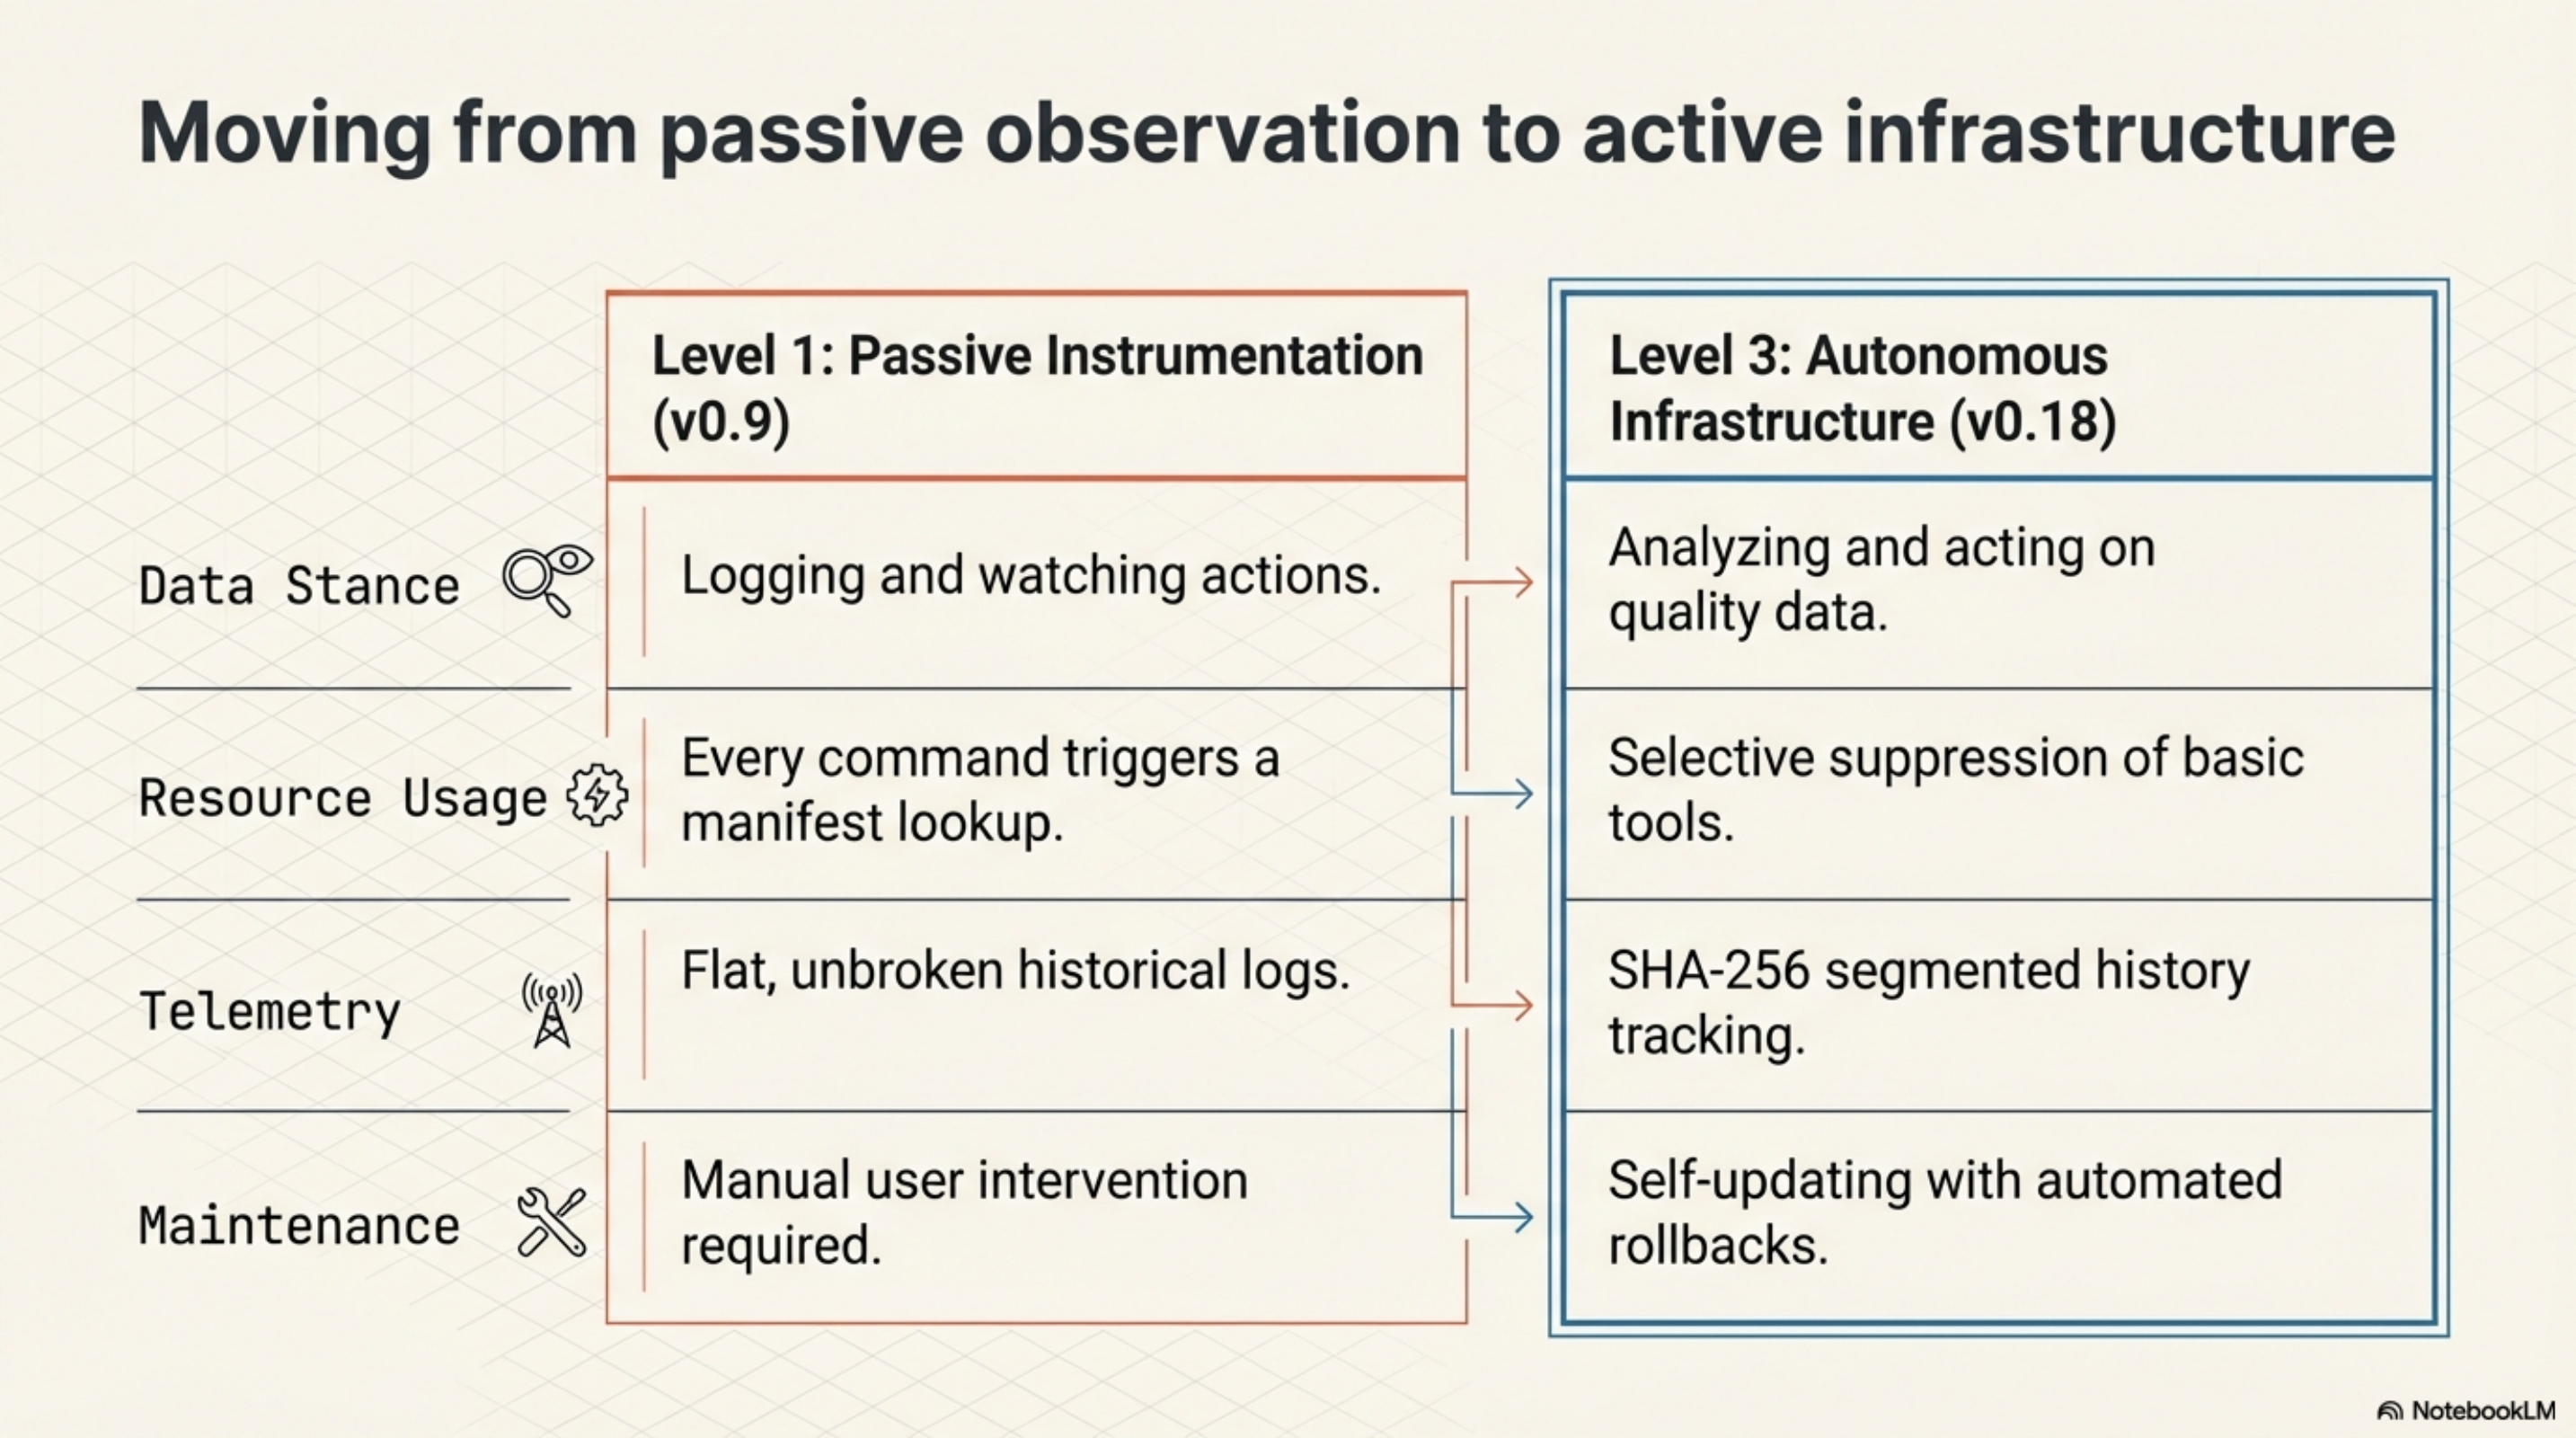
kcp-commands v0.9.0 and kcp-memory v0.4.0 were passive observers. They watched what Claude did, logged it, made it searchable. Useful, but limited. The tools had no opinions about their own data.
The work since then -- through kcp-commands v0.18.0 and kcp-memory v0.18.0 today -- has been about a different question: what happens when the tools know what to ignore, can measure their own quality, and maintain themselves?
The tool that learned what it does not need to teach
The suppression list (kcp-commands v0.14.0) is the feature that looks the smallest and matters the most.
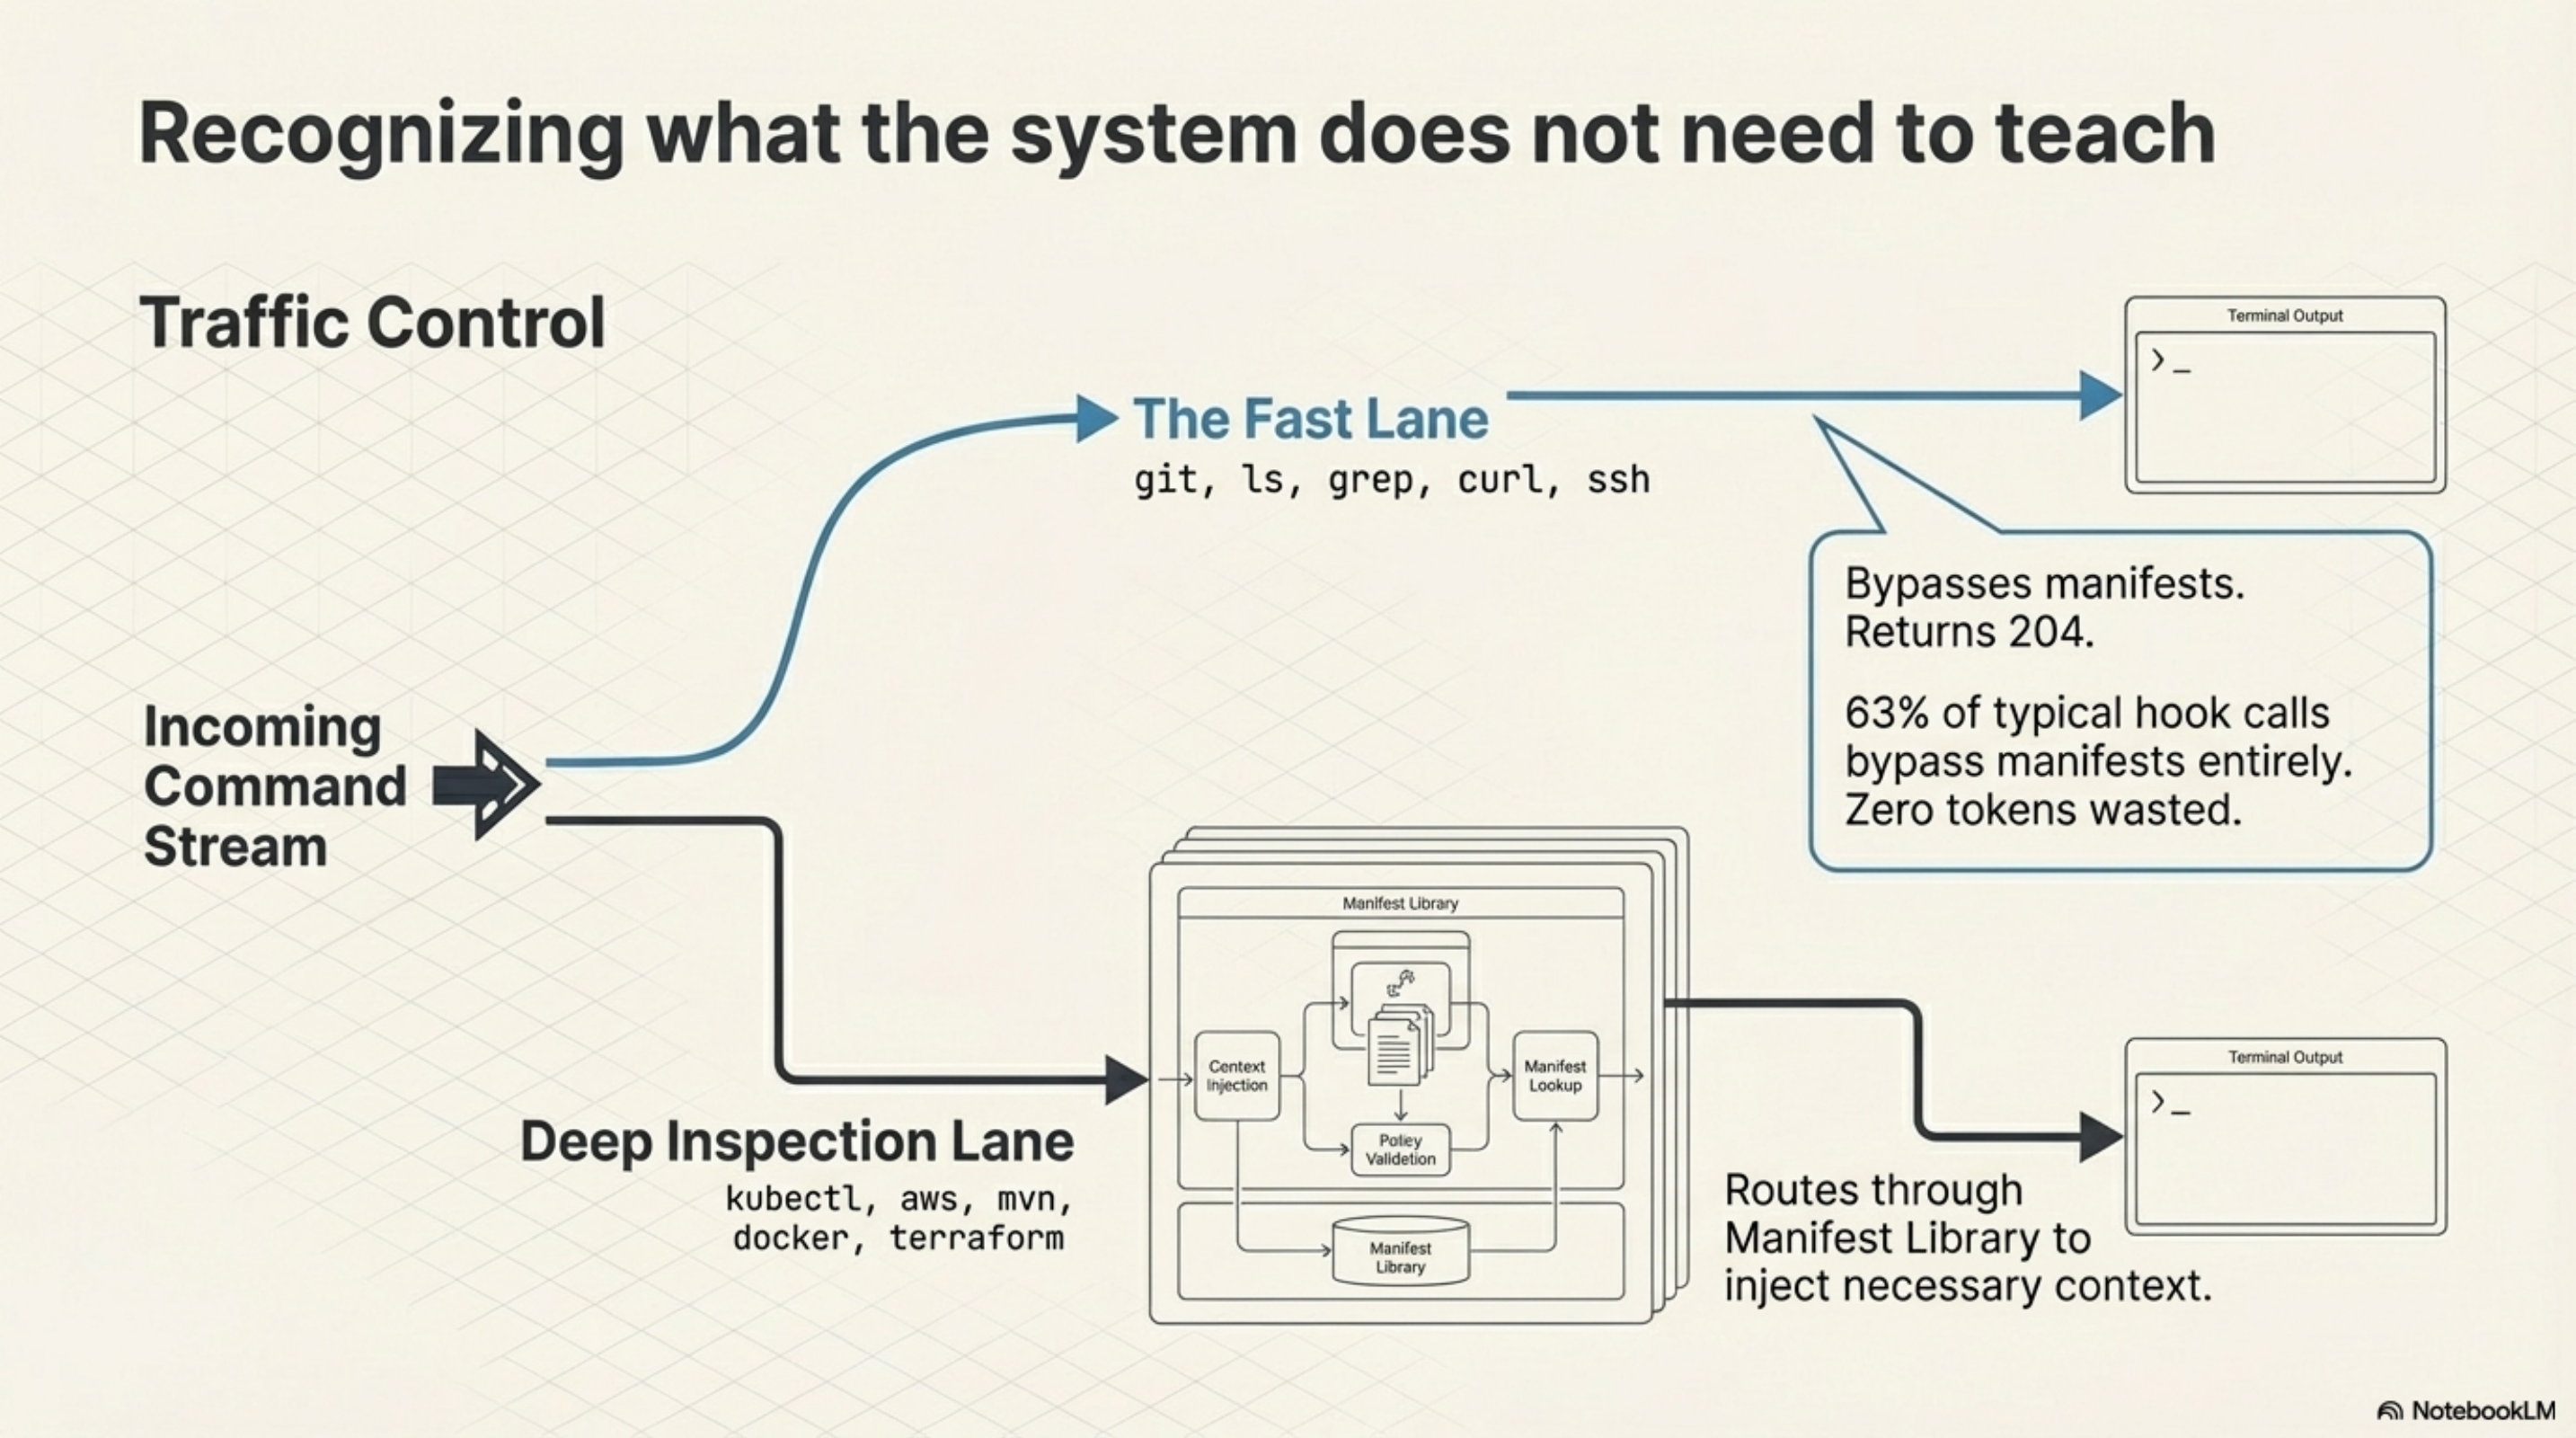
Before v0.14.0, every Bash tool call hit the manifest lookup. ls. grep. cd. The daemon dutifully checked whether a manifest existed, resolved it, and injected context. For commands any competent agent already knows -- and Claude knows ls -- this was wasted work. Not harmful, just pointless.
The suppression list is 40+ commands -- git, ls, grep, curl, ssh, the entire text-processing and filesystem toolkit -- that return 204 immediately. No manifest lookup. No tokens injected. The daemon recognises what it does not need to teach.
The result: 63% of hook calls in a typical session never touch the manifest library. The performance model changed. Manifest lookup is no longer the common case. It is the exception, reserved for commands where the agent actually benefits from guidance: kubectl, aws, mvn, docker, terraform.
Users can override with ~/.kcp/suppress.txt. One command per line. The default list is opinionated but replaceable.
Knowing which version of the truth was active
Manifest version tracking (kcp-commands v0.16.0) stamps every Phase A event with the first 8 hex characters of the SHA-256 hash of the YAML file that was active at invocation time. The field is manifest_version in events.jsonl.
This sounds like bookkeeping. It is not. Without version tracking, all history is flat. The retry rate for kubectl-apply is one number across all time. With version tracking, the history segments by which artifact was active. "Before the manifest was fixed" and "after" become distinct populations.
The quality metrics (next section) depend on this. A manifest with a 38% retry rate that drops to 12% after a rewrite is evidence that the rewrite worked. Without the version hash, those two rates are averaged into a single 25% and the signal is invisible.
![]()
The quality loop closed
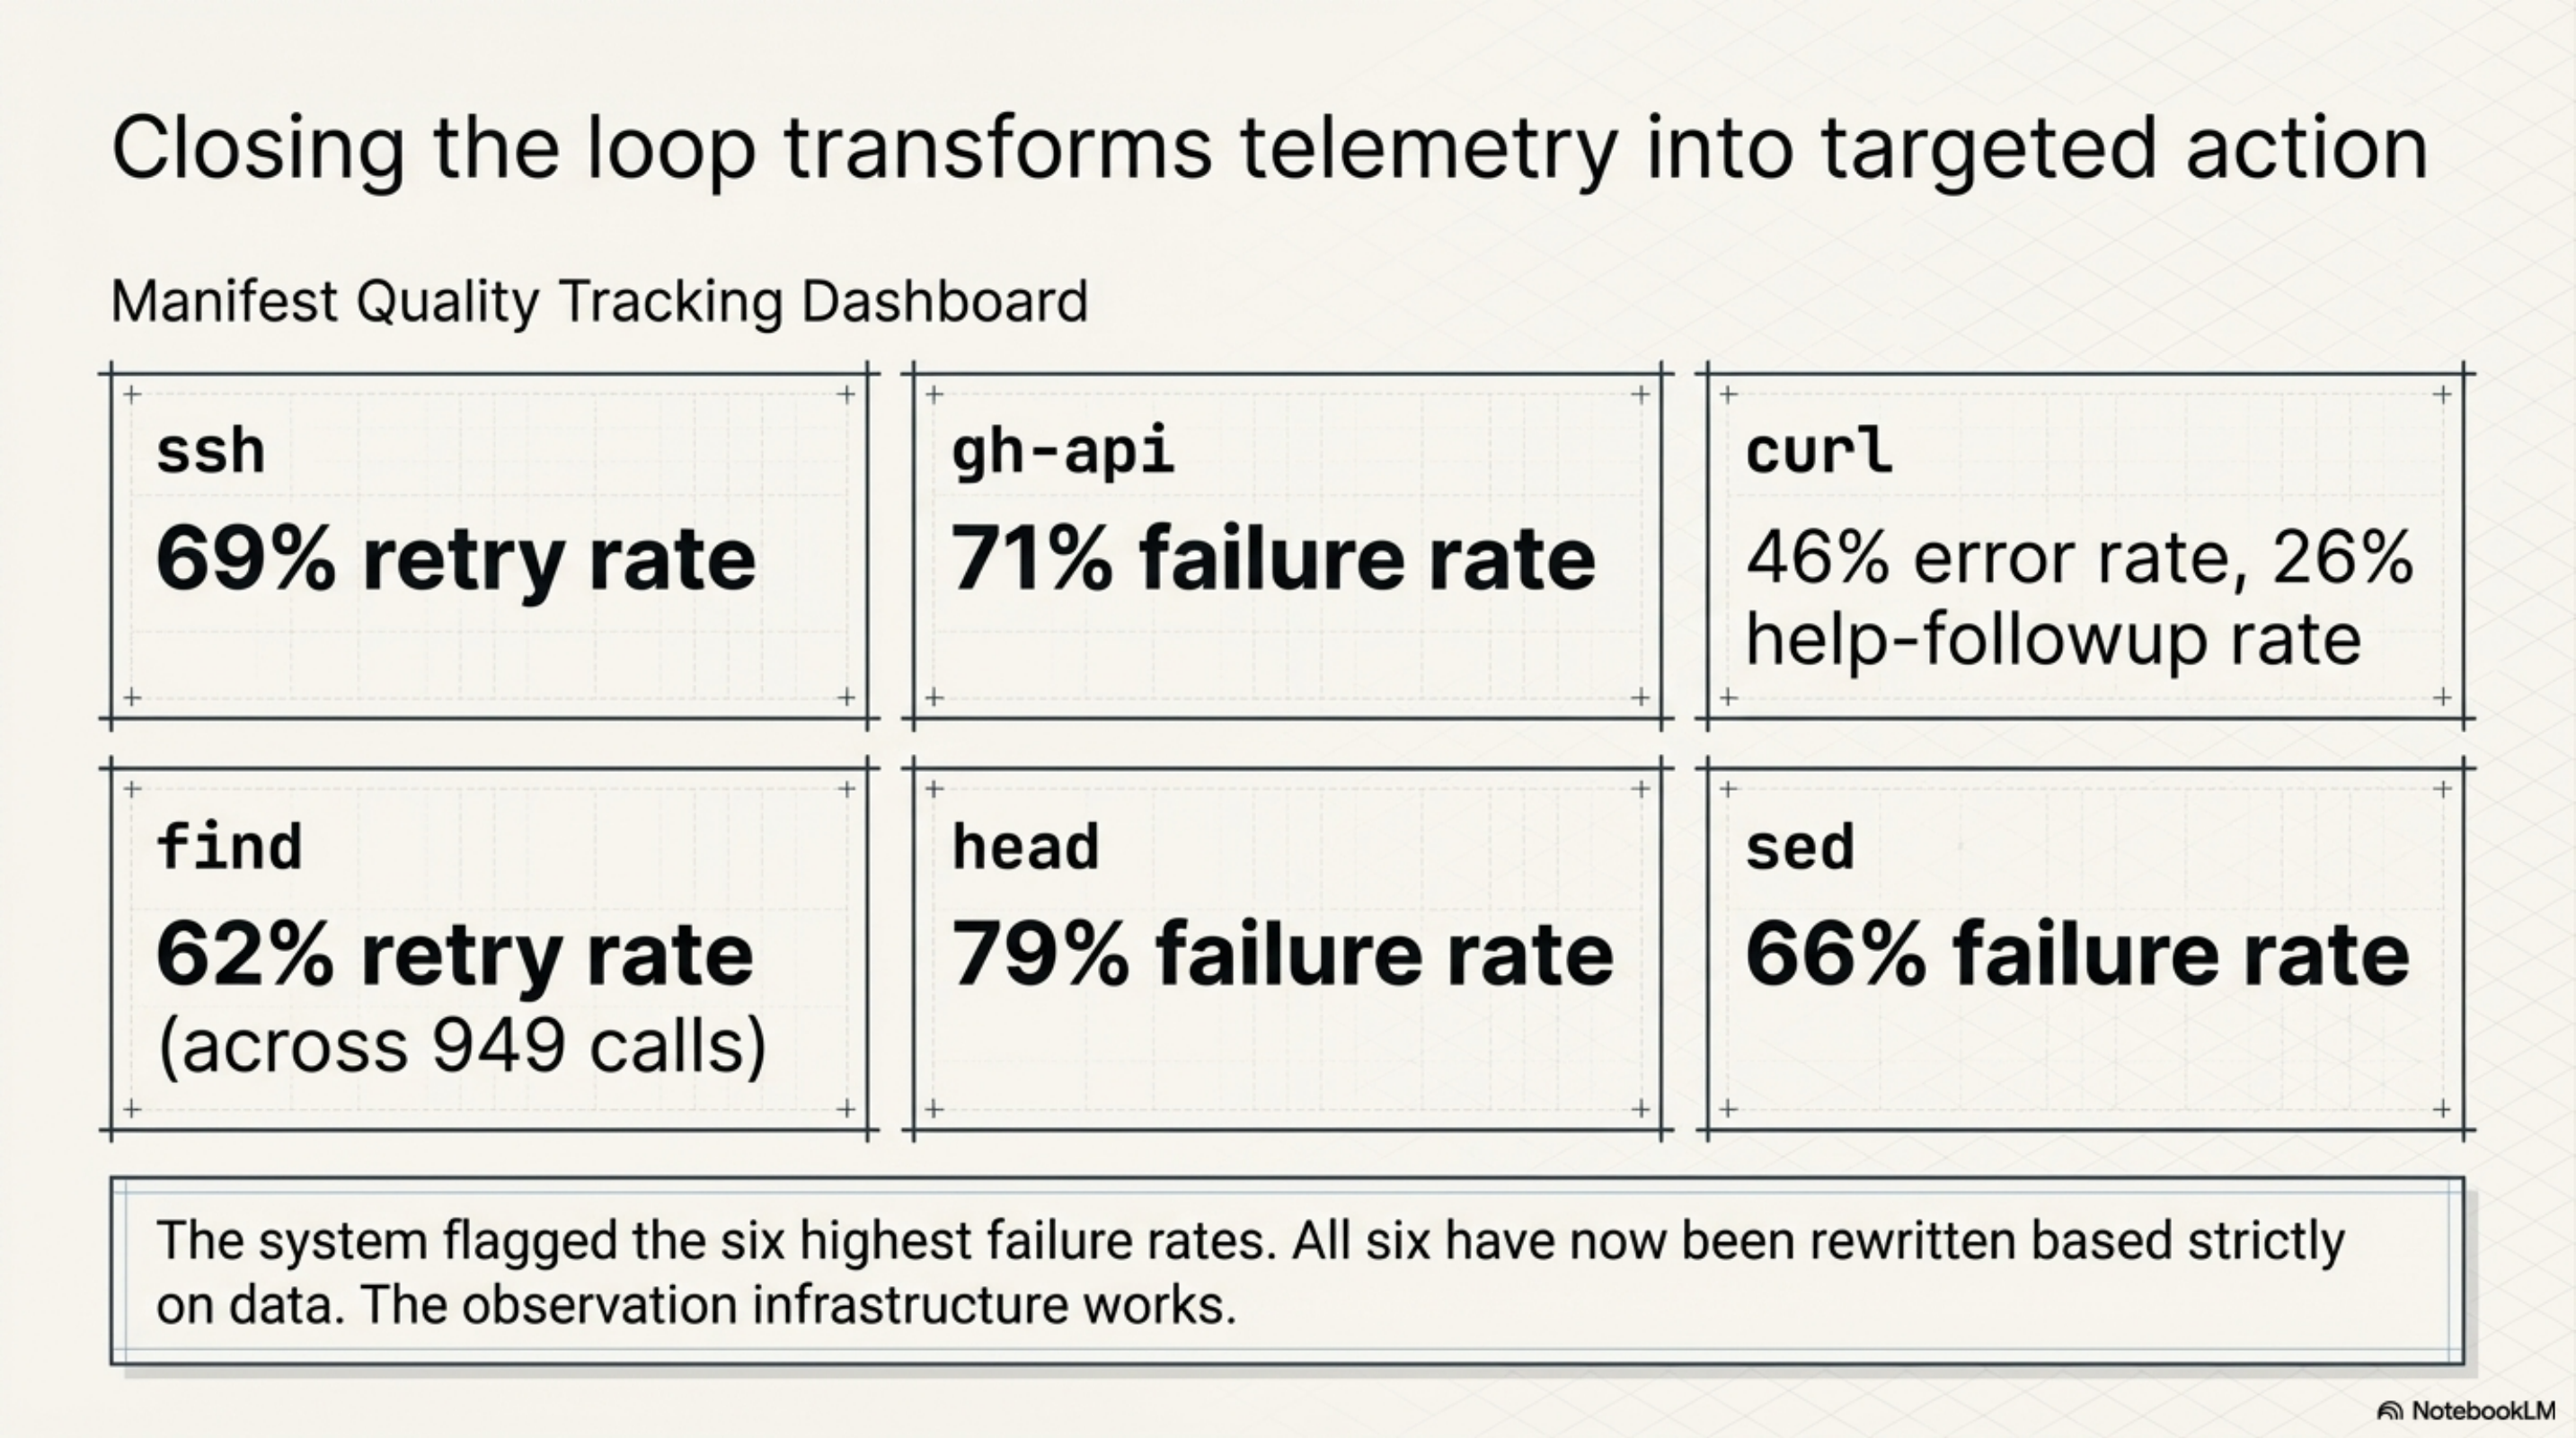
The manifest quality feedback loop -- exit_code_hint in kcp-commands v0.15.0, kcp-memory analyze in kcp-memory v0.7.0 -- is covered in detail in today's companion post. The short version: every tool call now carries an outcome signal (clean or error), and kcp-memory analyze aggregates retry rate, help-followup rate, and error rate per manifest key.
What matters for this post: the first round of data-driven improvements has shipped. The six manifests with the highest failure rates -- ssh at 69% retry, gh-api at 71%, curl at 46% error plus 26% help-followup, find at 62% retry across 949 calls, head at 79%, sed at 66% -- have been rewritten based on what the data showed was failing. The loop closed. This is the proof-of-concept that the observation infrastructure was worth building.
Subagent memory
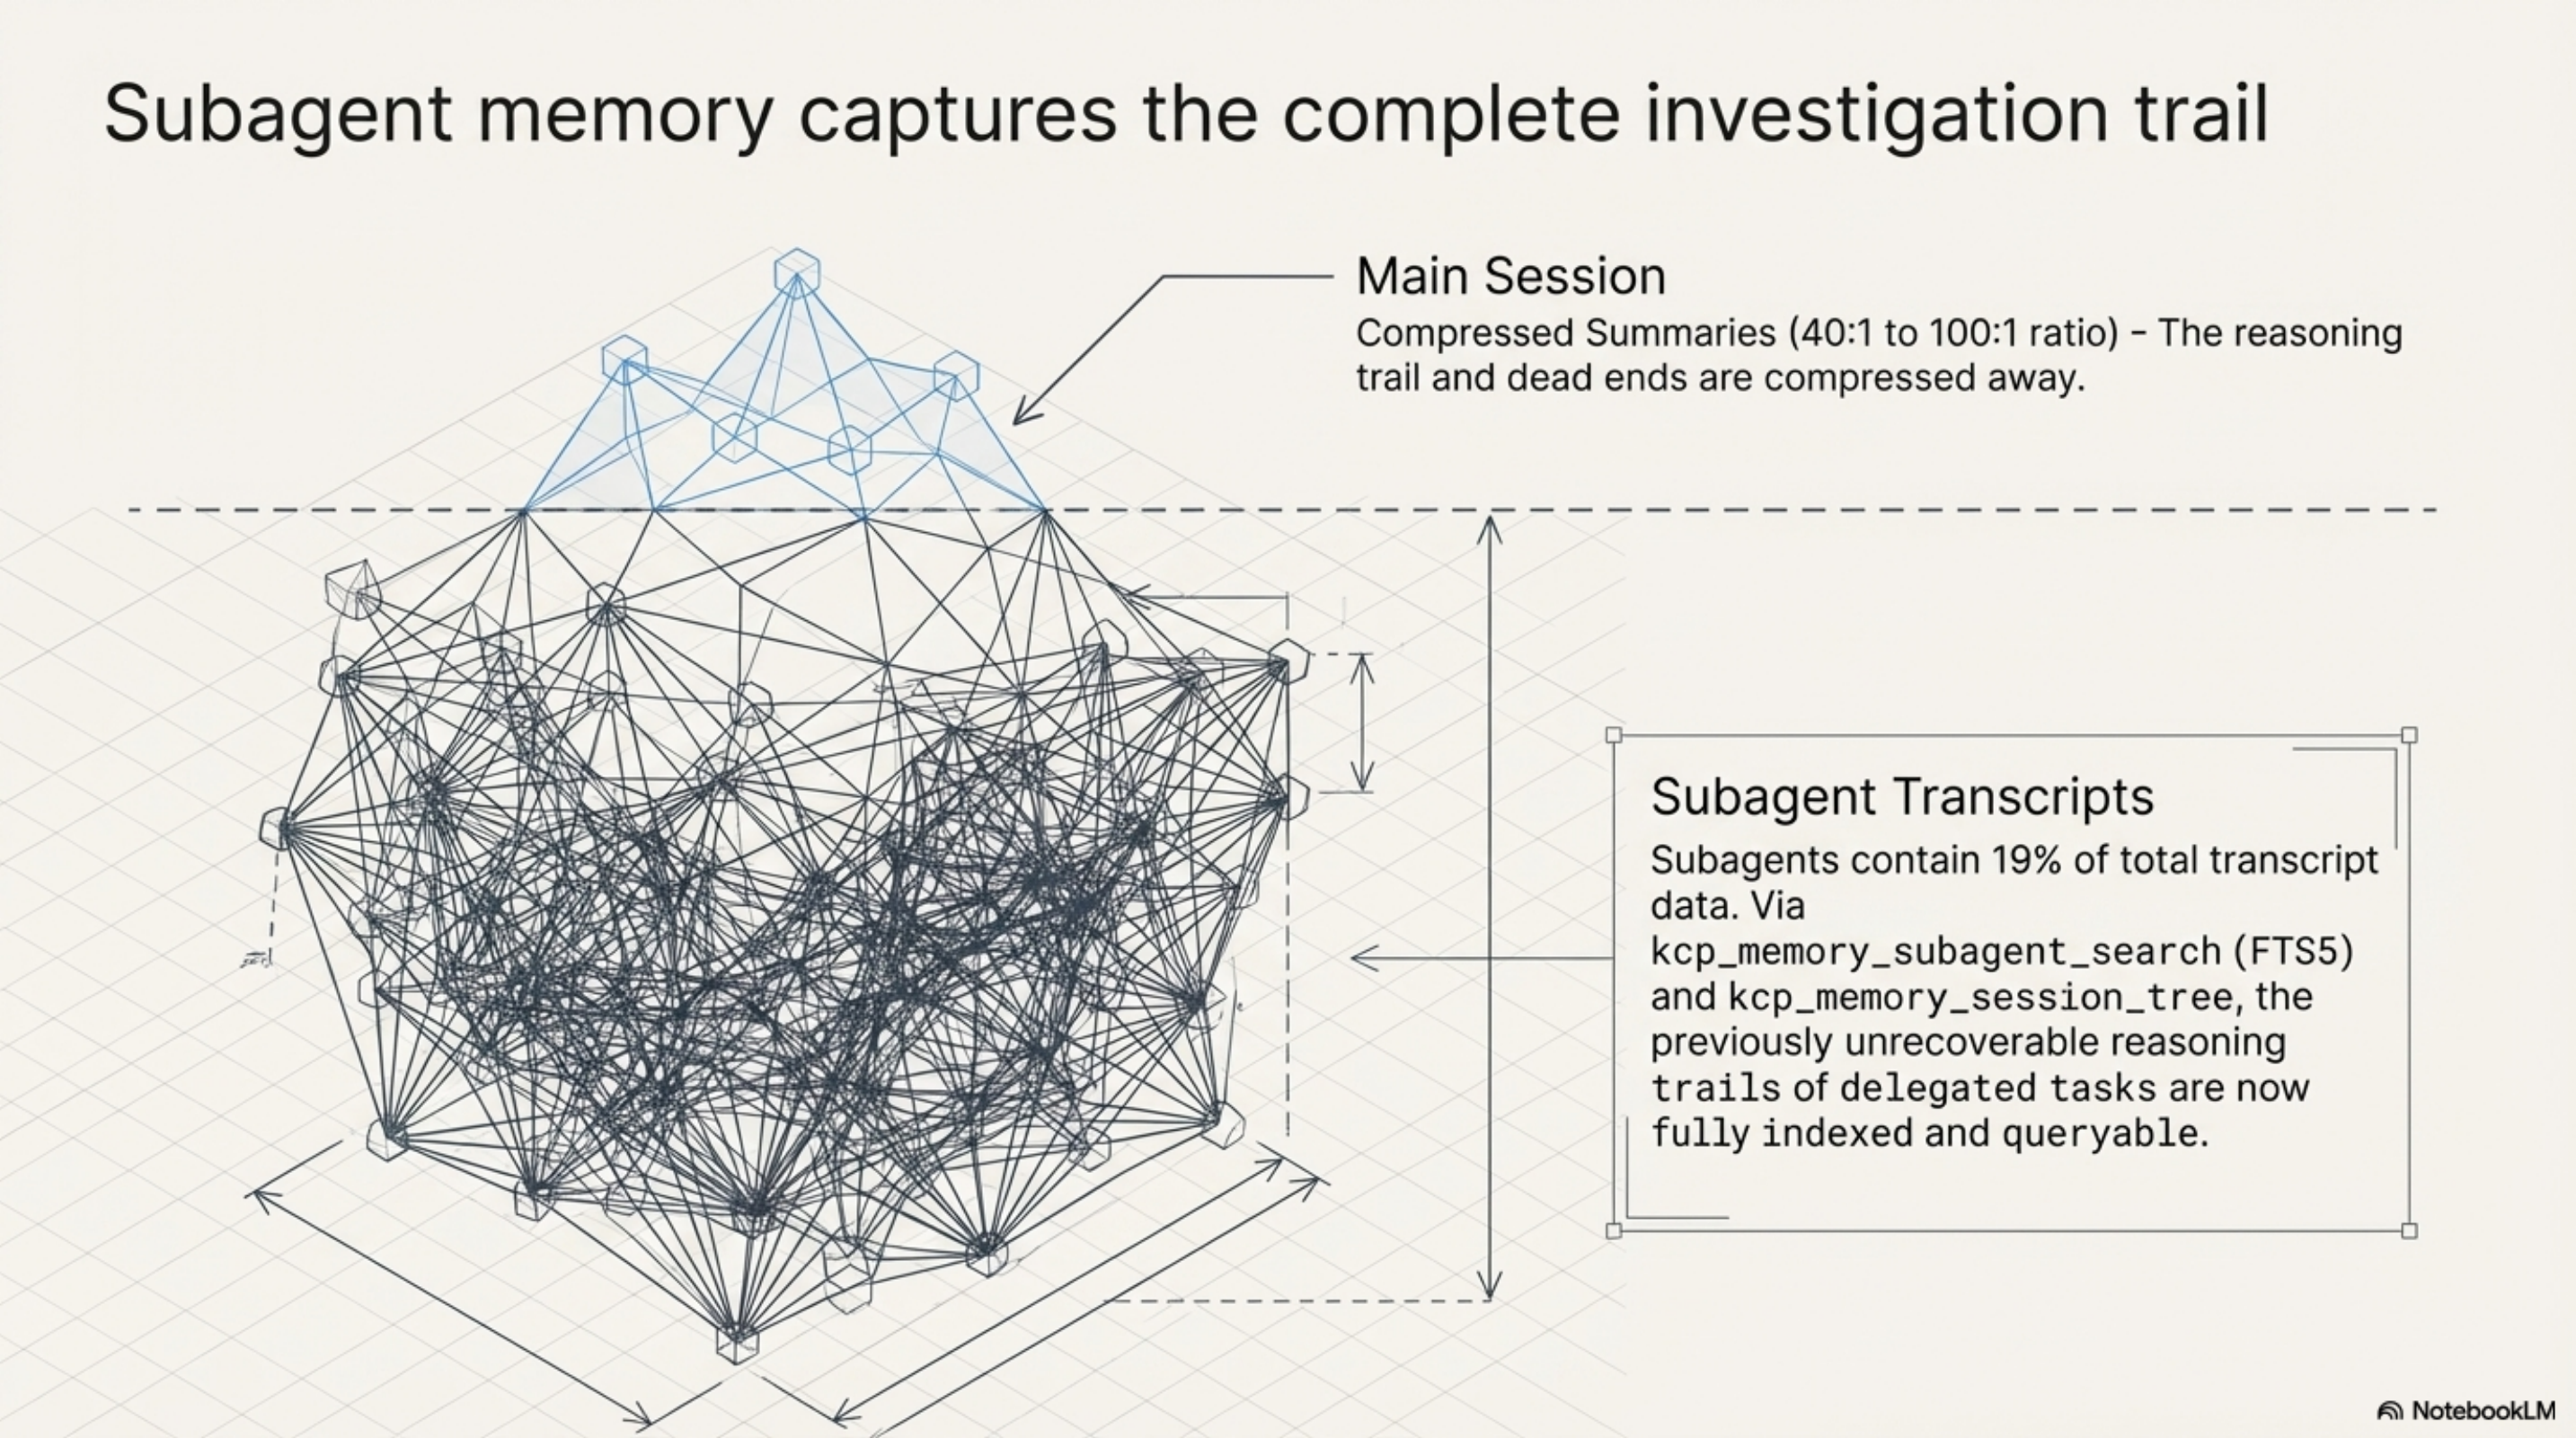
When Claude Code delegates via the Task tool, subagents write their own transcript files alongside the main session. The main session receives a compressed summary -- a few lines from an investigation that may have taken dozens of tool calls. The reasoning trail, the dead ends, the rejected approaches: all compressed away.
kcp-memory v0.5.0 indexes those subagent files and links them to their parent sessions. Two new MCP tools: kcp_memory_subagent_search (FTS5 over subagent transcripts) and kcp_memory_session_tree (parent session with all child agents as a tree).
The numbers: in a typical session with heavy delegation, subagents contain 19% of total transcript data. The summaries that the main session sees compress at 40:1 to 100:1. What was previously unrecoverable -- the full investigation trail of a delegated task -- is now queryable.
Analysis as a working tool, not a separate operation
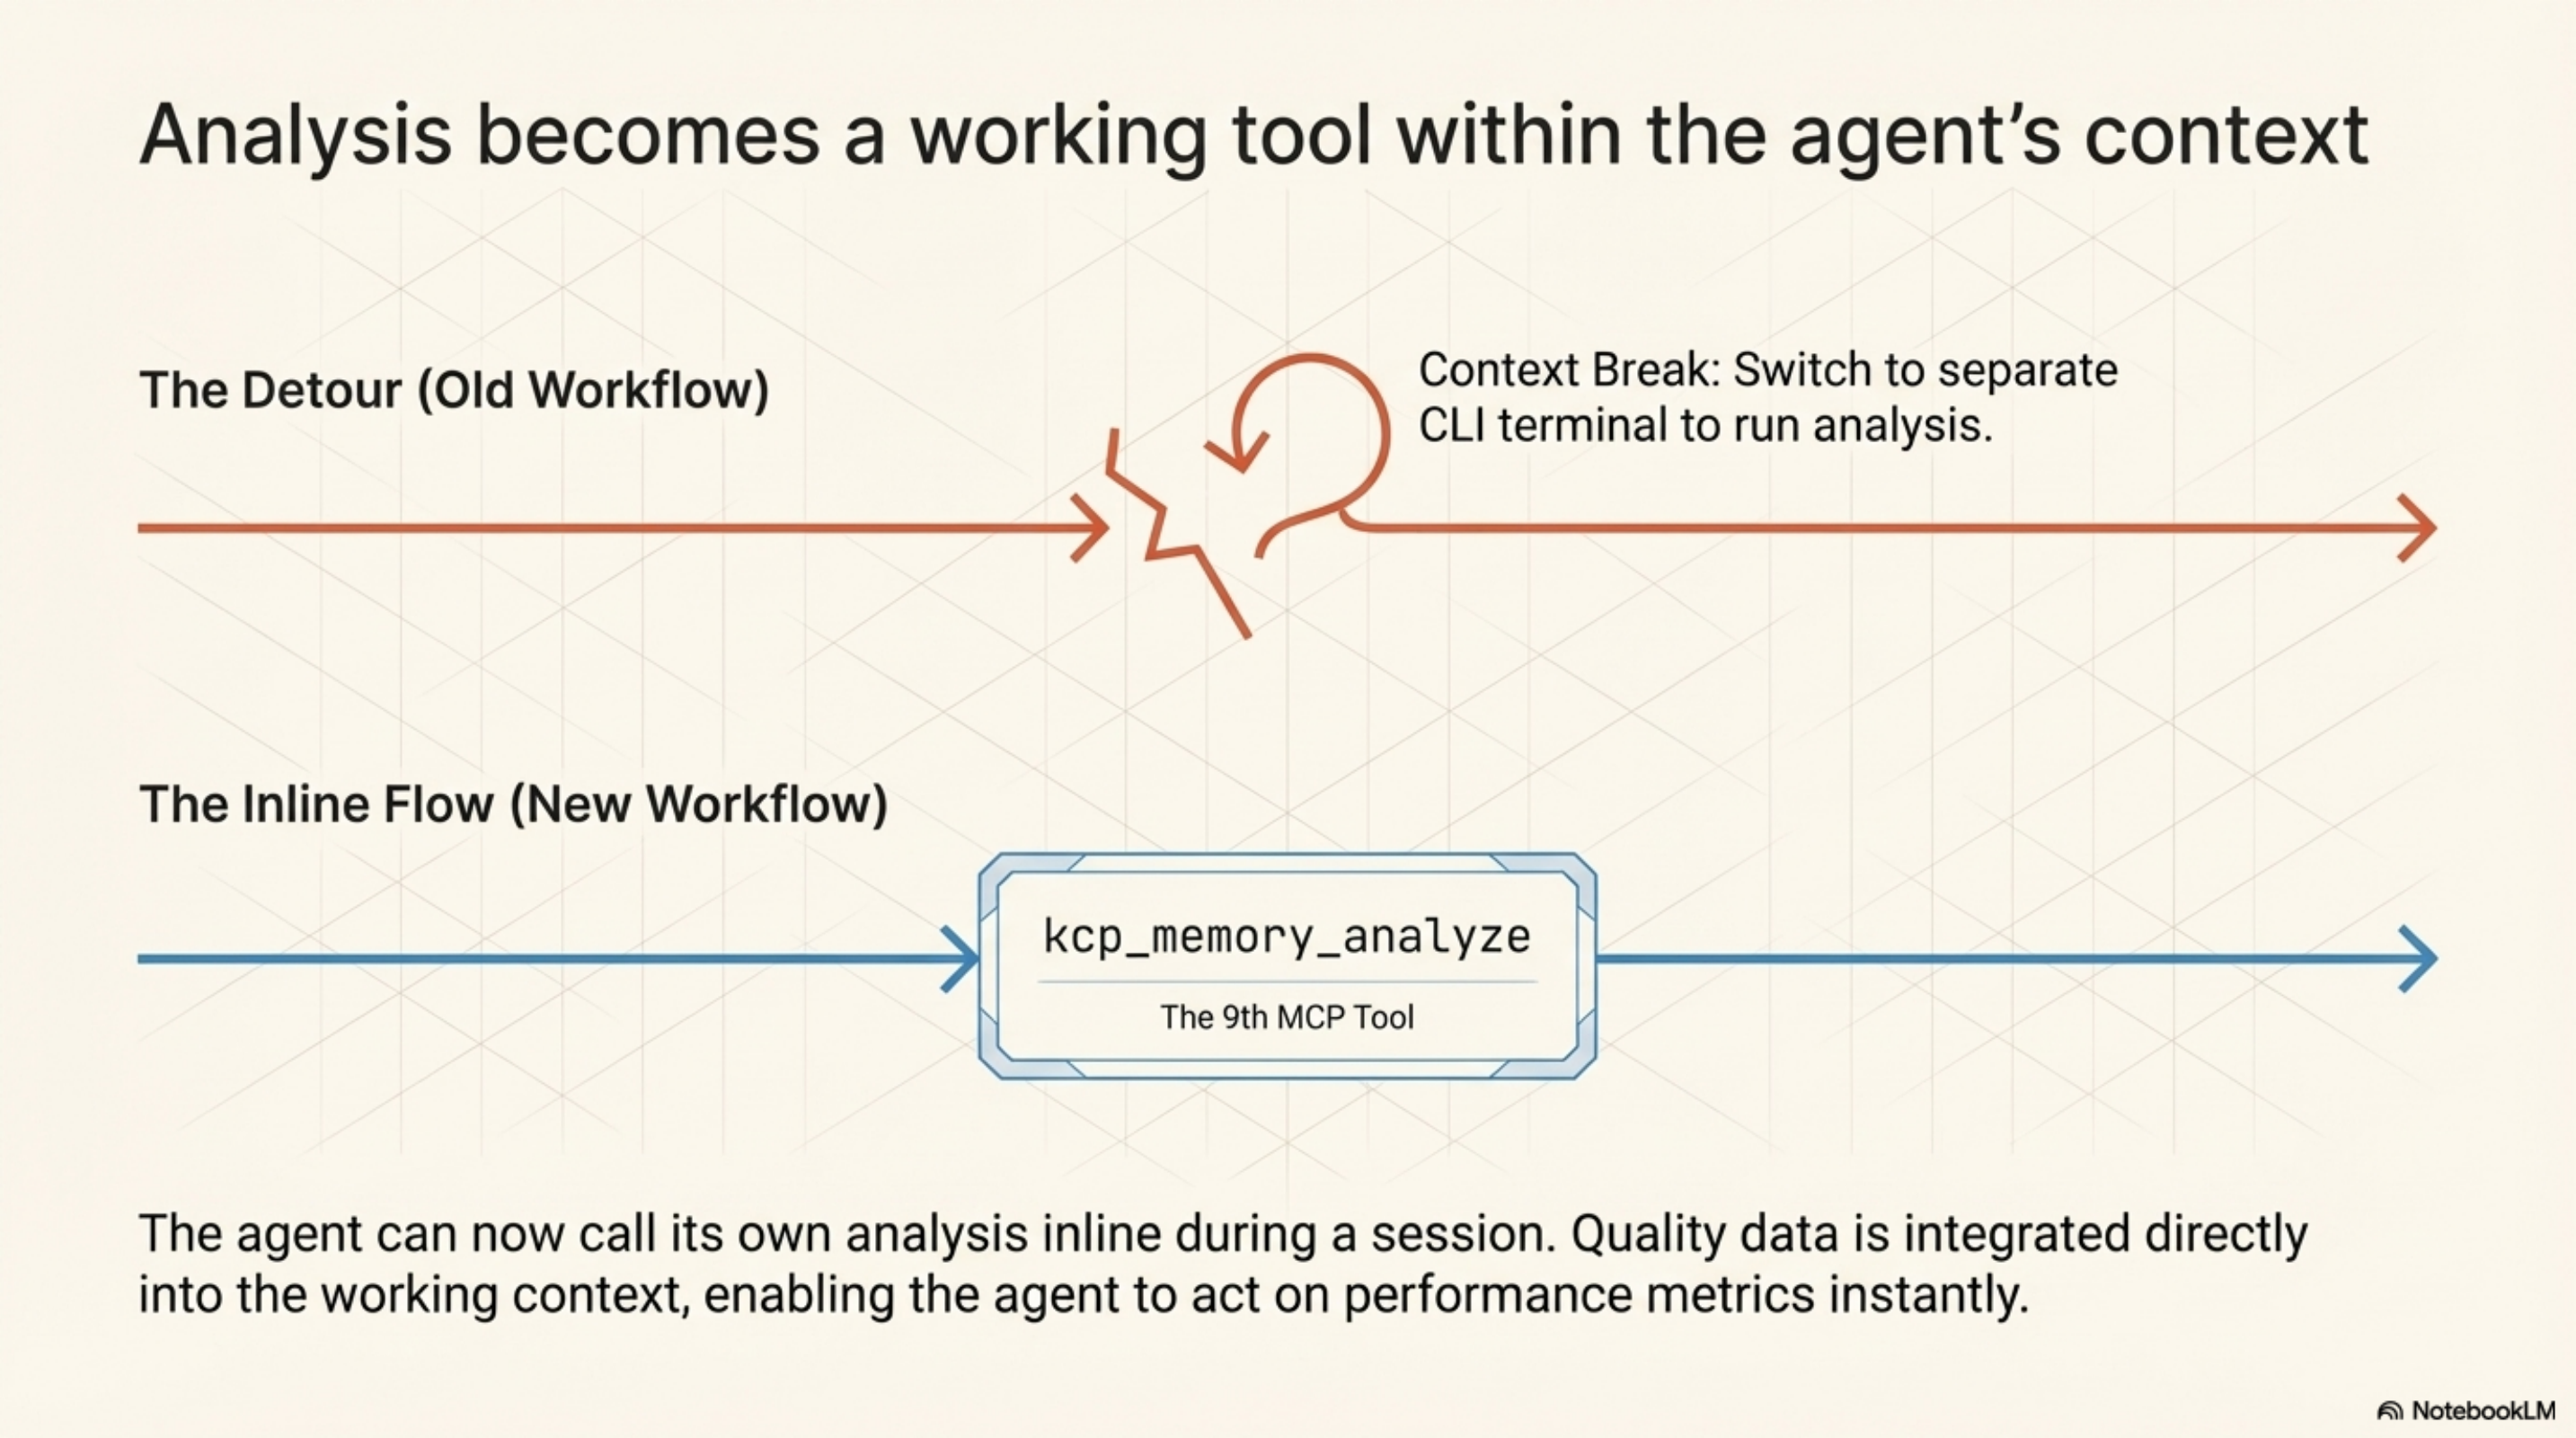
kcp-memory analyze started as a CLI command. You would switch to the terminal, run it, read the output, switch back. That workflow breaks the context. If the agent is the one that should be acting on quality data, the agent should be able to read it.
kcp-memory v0.17.0 exposes the analysis as kcp_memory_analyze -- the 9th MCP tool. Claude can call it inline during a session. Same parameters: since_days, min_calls, top, by_version. The analysis is now part of the working context, not a detour.
The tools maintain themselves
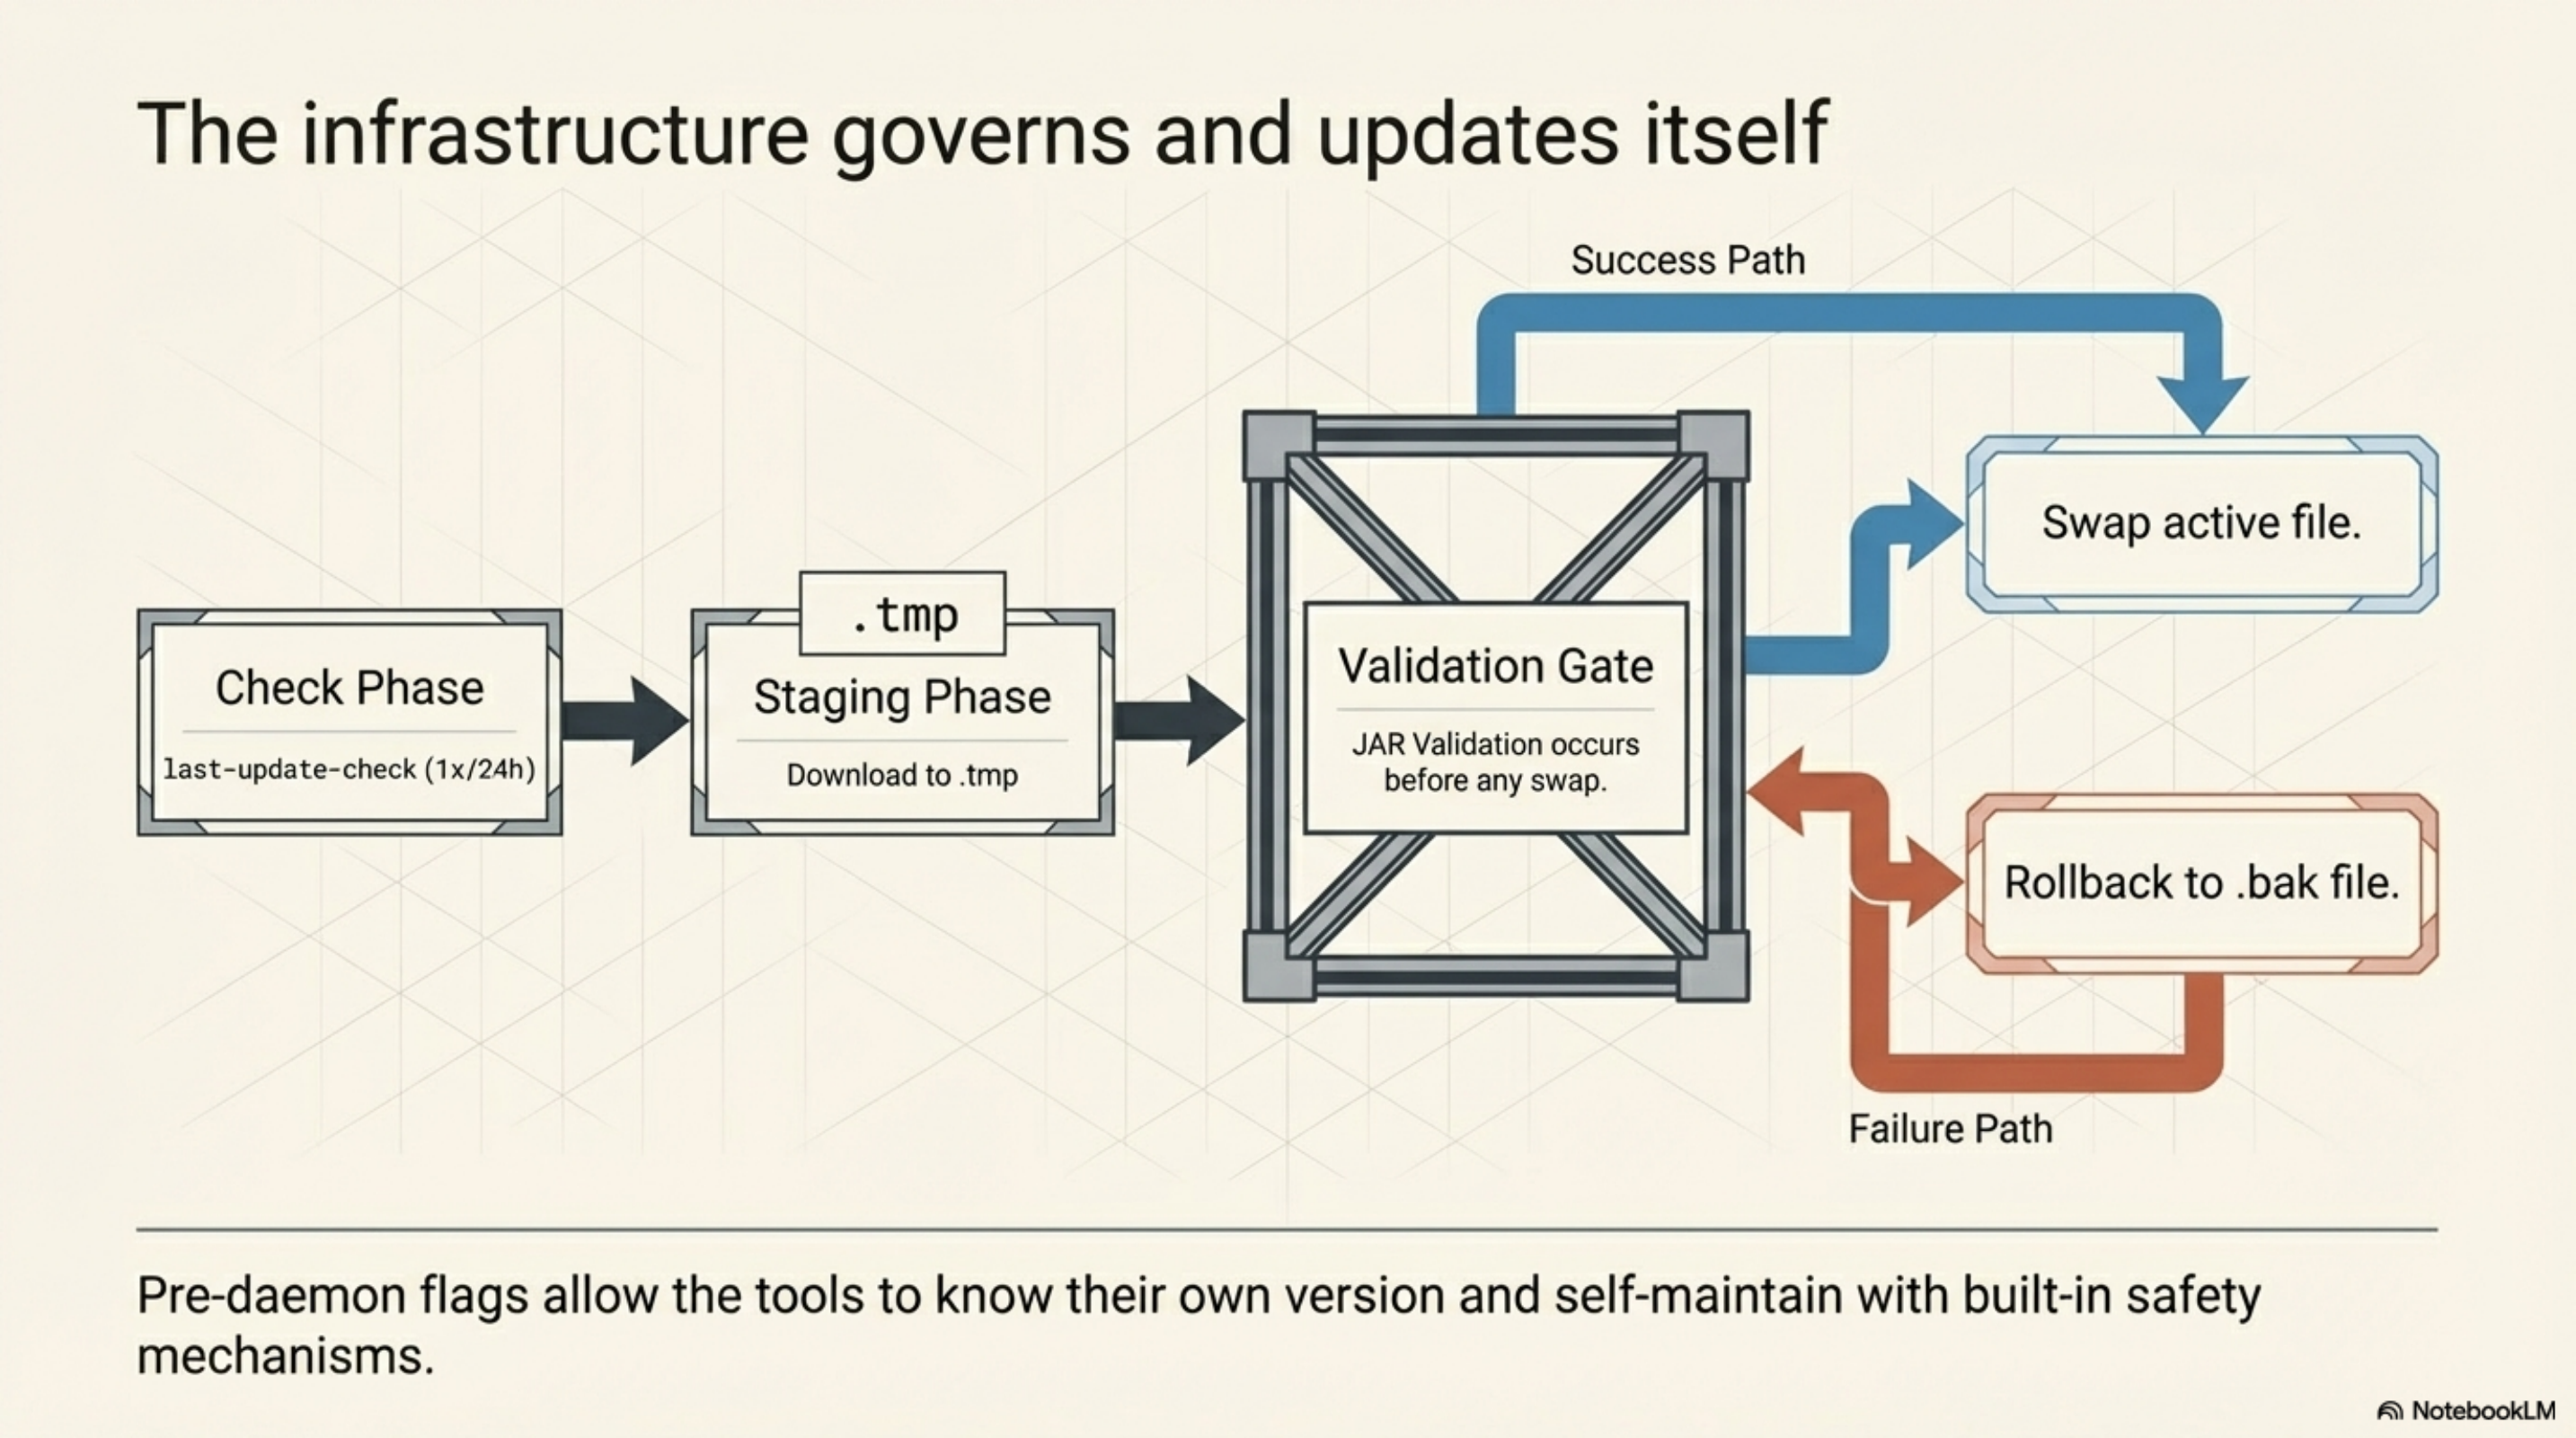
kcp-commands v0.18.0 and kcp-memory v0.18.0 both know their own version and can check for newer releases.
kcp-commands: --update and --check-update as pre-daemon flags. kcp-memory: update subcommand with --check (scriptable, exit code 1 if update available) and --yes (non-interactive). Both share ~/.kcp/last-update-check -- a JSON file that coordinates GitHub API calls to a single check per 24-hour window.
The update itself: .tmp staging, .bak rollback, JAR validation before any swap. If the new JAR fails validation, the old one stays. On first startup each day, a notification tells you if an update is available. Once. Not every session.
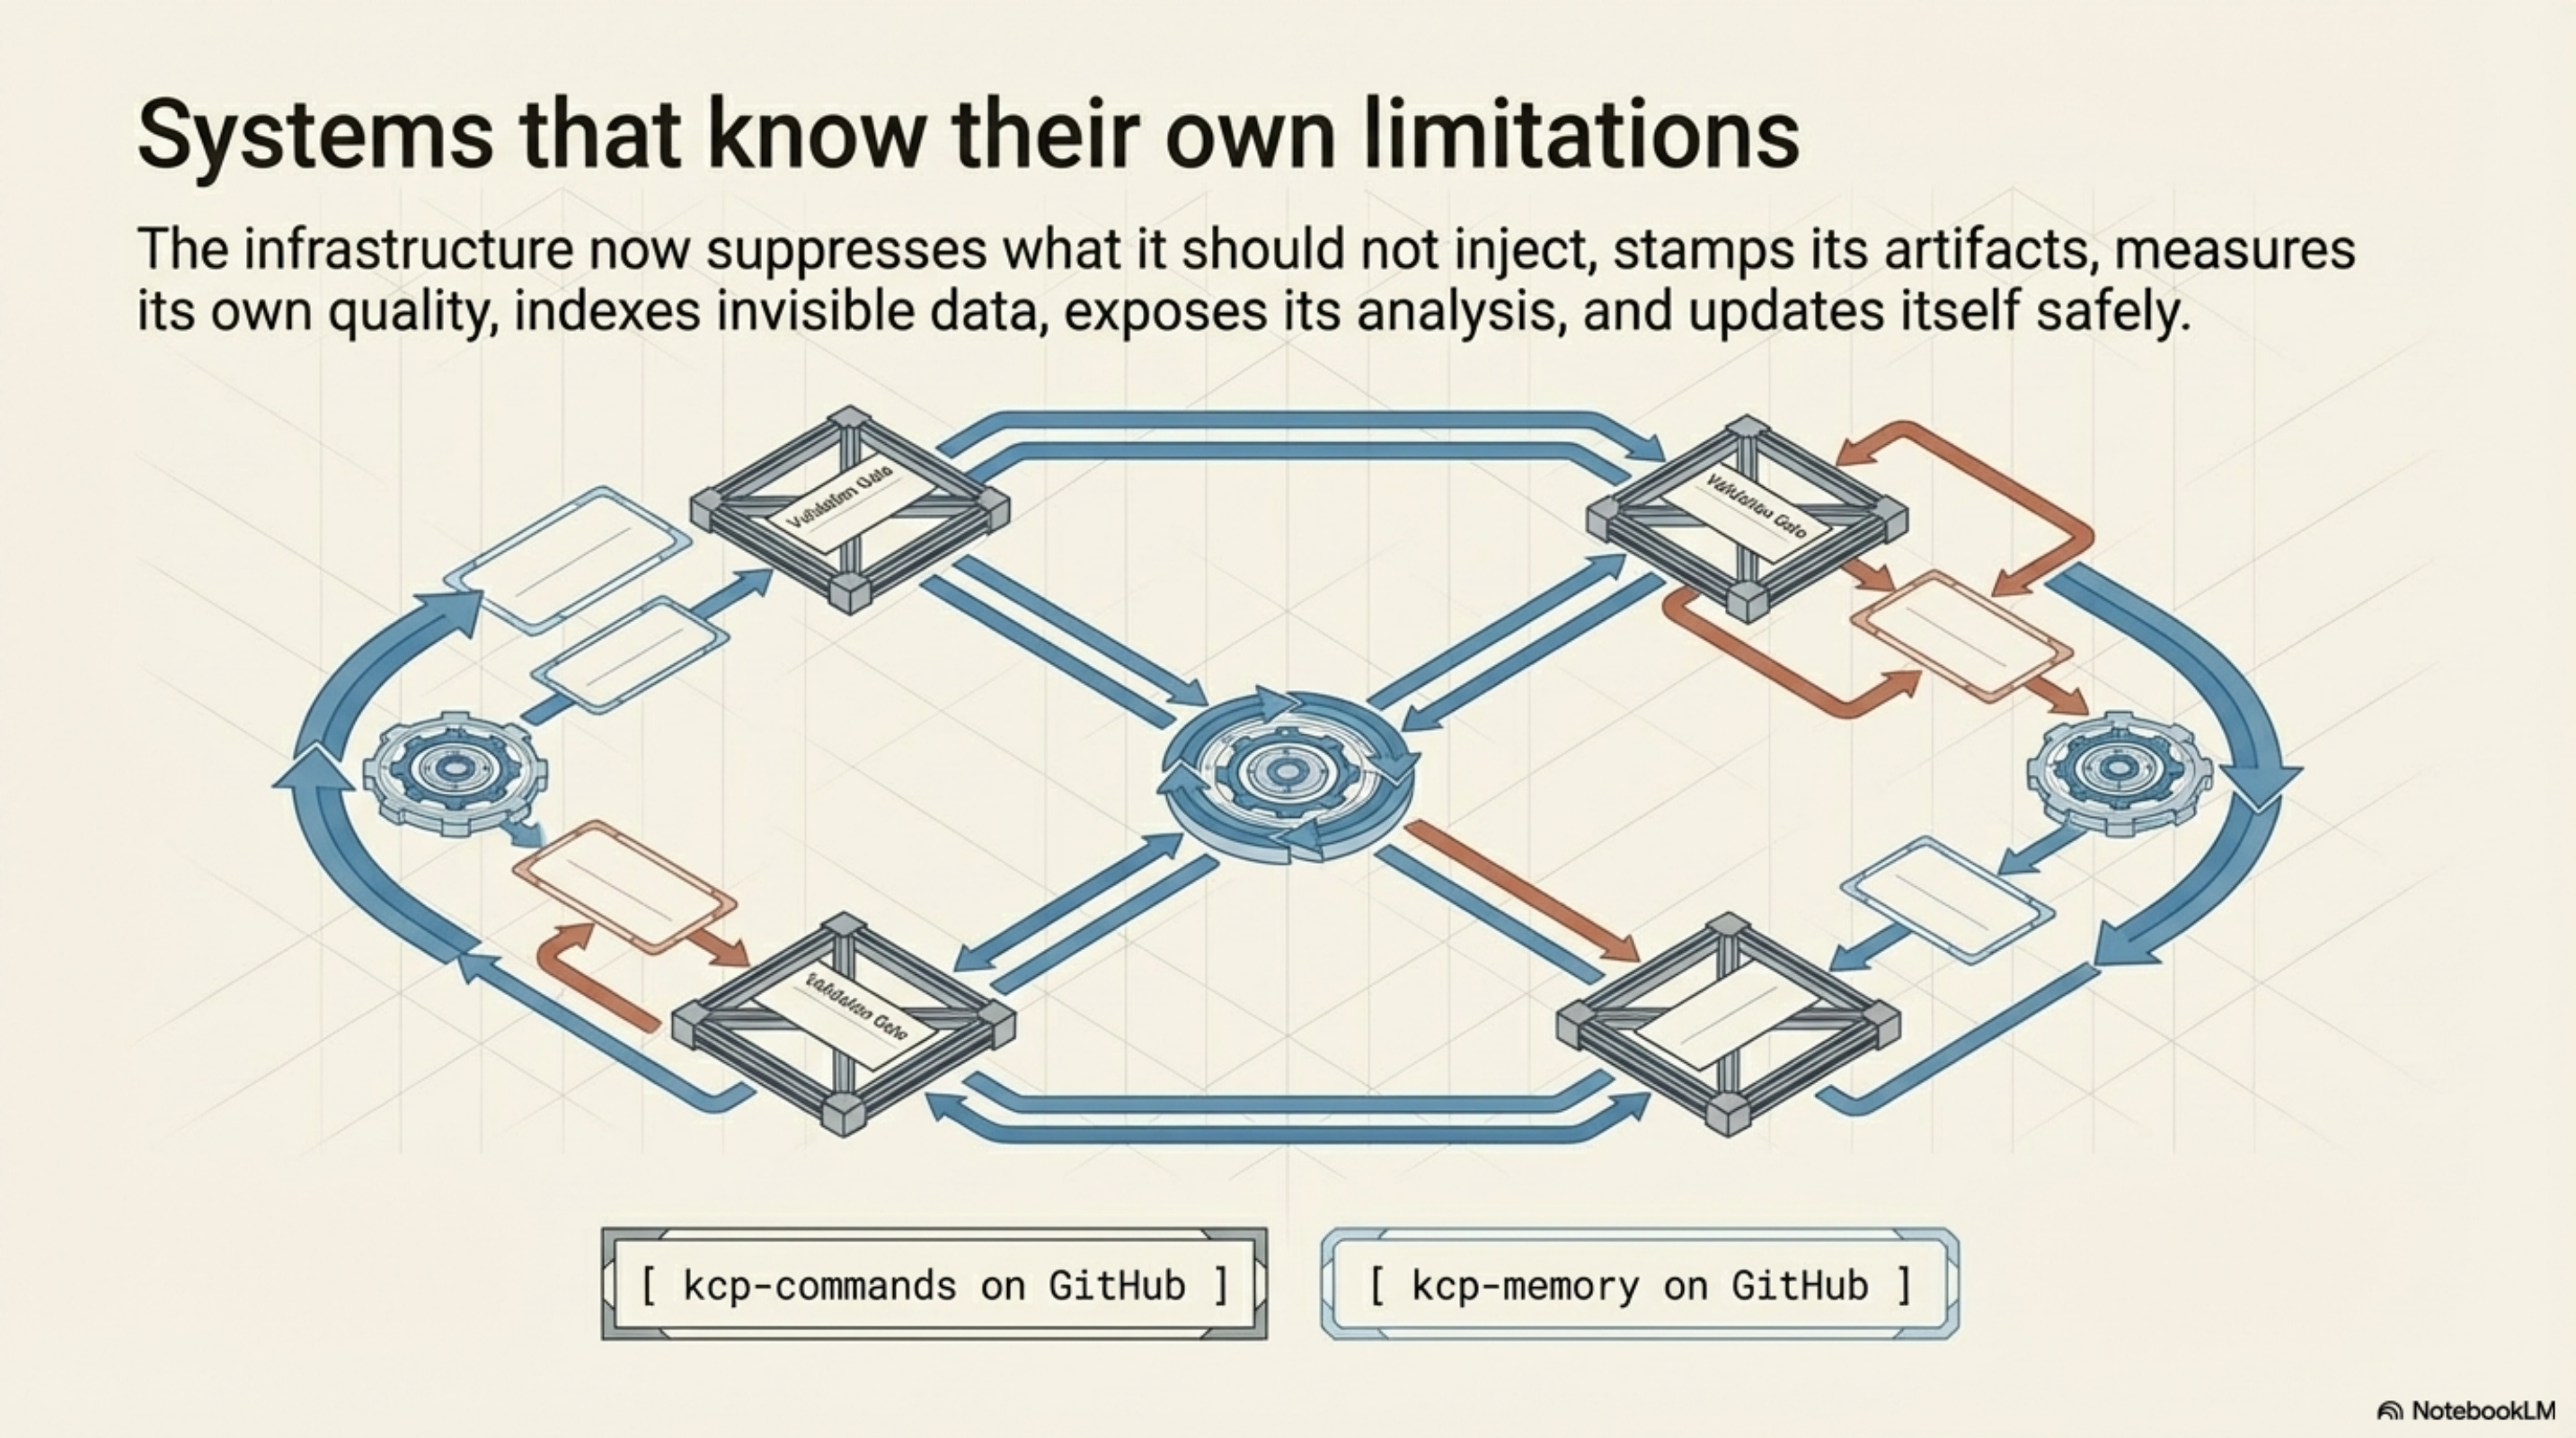
This is the last piece of the arc. The tools started as passive hooks that helped an agent. They now suppress what they should not inject, stamp their artifacts with content hashes, measure their own quality, index previously invisible data, expose their analysis to the agent, and update themselves. The infrastructure knows its own limitations and maintains itself.
Try it
# Install kcp-commands (Java daemon)
curl -fsSL https://raw.githubusercontent.com/Cantara/kcp-commands/main/bin/install.sh | bash -s -- --java

# Install kcp-memory (episodic memory + MCP)
curl -fsSL https://raw.githubusercontent.com/Cantara/kcp-memory/main/bin/install.sh | bash

# Check for updates (both tools)
java -jar ~/.kcp/kcp-commands-daemon.jar --check-update
kcp-memory update --check

# Run the quality analysis
kcp-memory analyze --top 10
kcp-memory analyze --by-version

# Search subagent memory
kcp-memory agents search "rejected approach"
kcp-commands on GitHub — kcp-memory on GitHub
Series: Knowledge Context Protocol
← The Manifest Quality Feedback Loop · Part 22 of 24 · kcp-dashboard: Observability for the KCP Ecosystem →