The Manifest Quality Feedback Loop
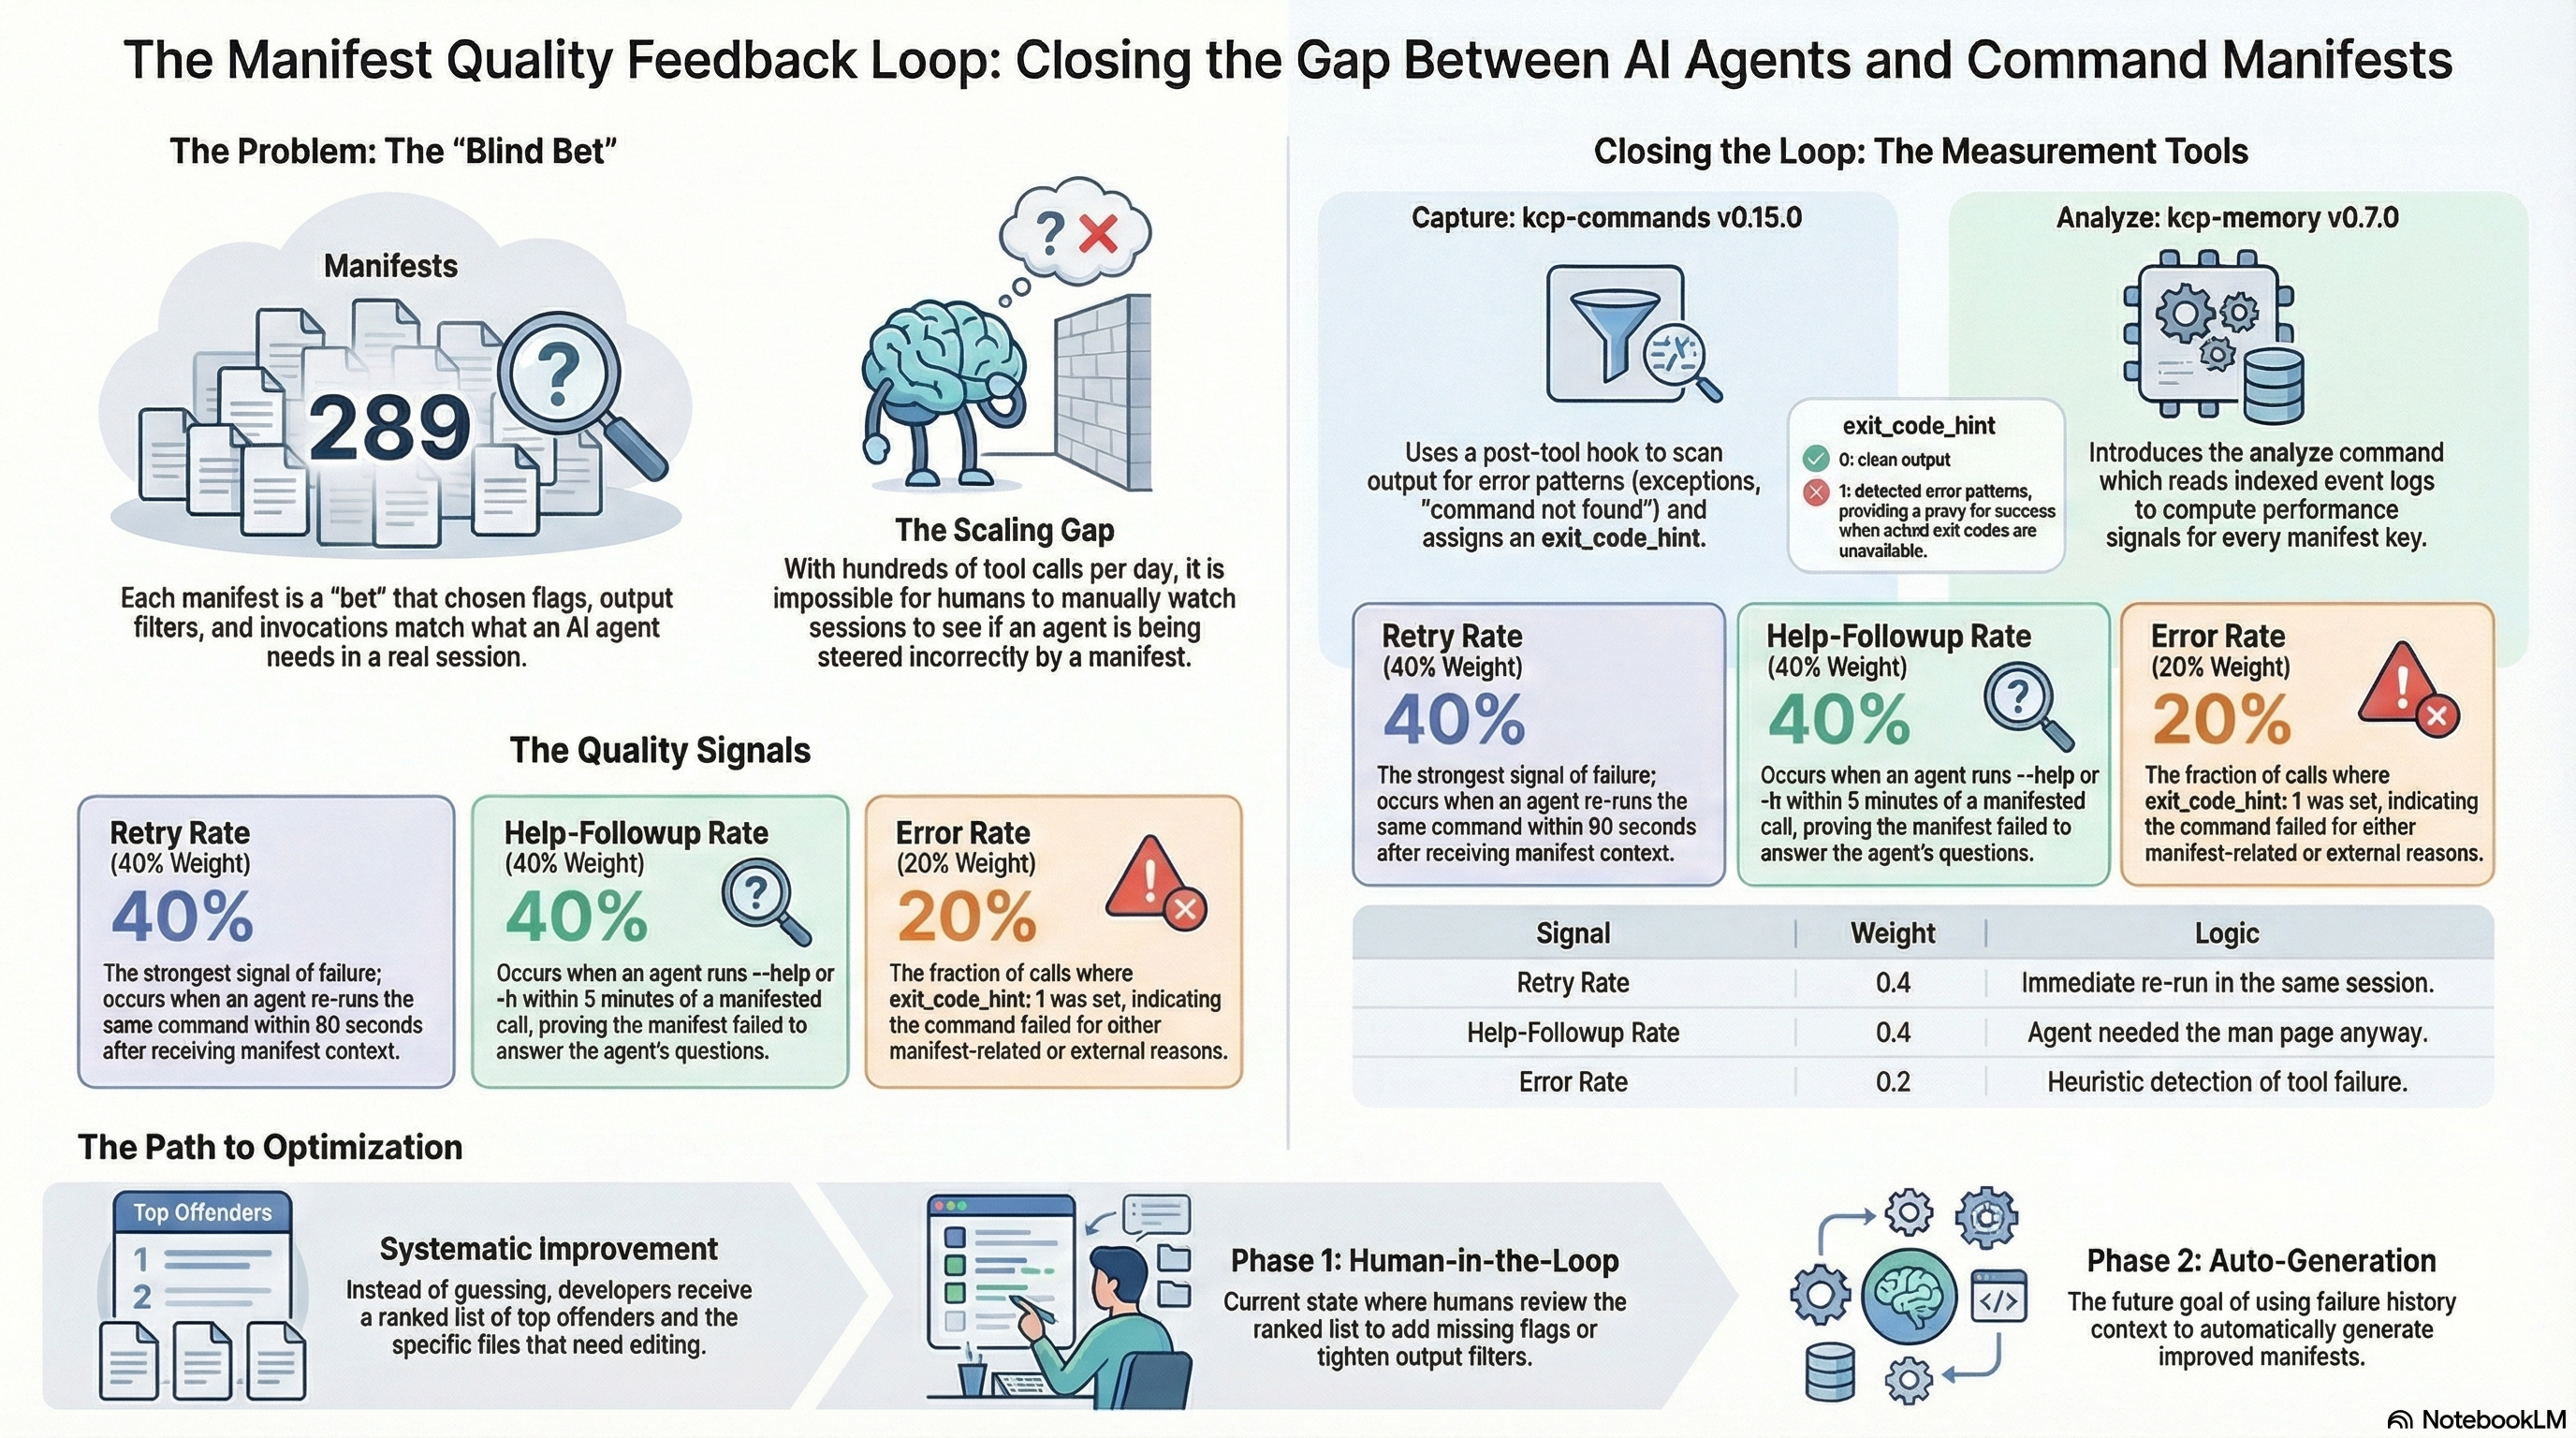
kcp-commands ships 291 manifests. Each one is a bet: that the flags we chose are the ones the agent will actually need, that the output filter is tight enough, that the preferred invocations match real usage. Some of those bets pay off. Some do not.
Until now there was no way to know which. A manifest for kubectl apply could be steering the agent into the wrong flags on every invocation, and we would never see it unless we happened to watch the session in real time. At 291 manifests and hundreds of tool calls per day, that does not scale.
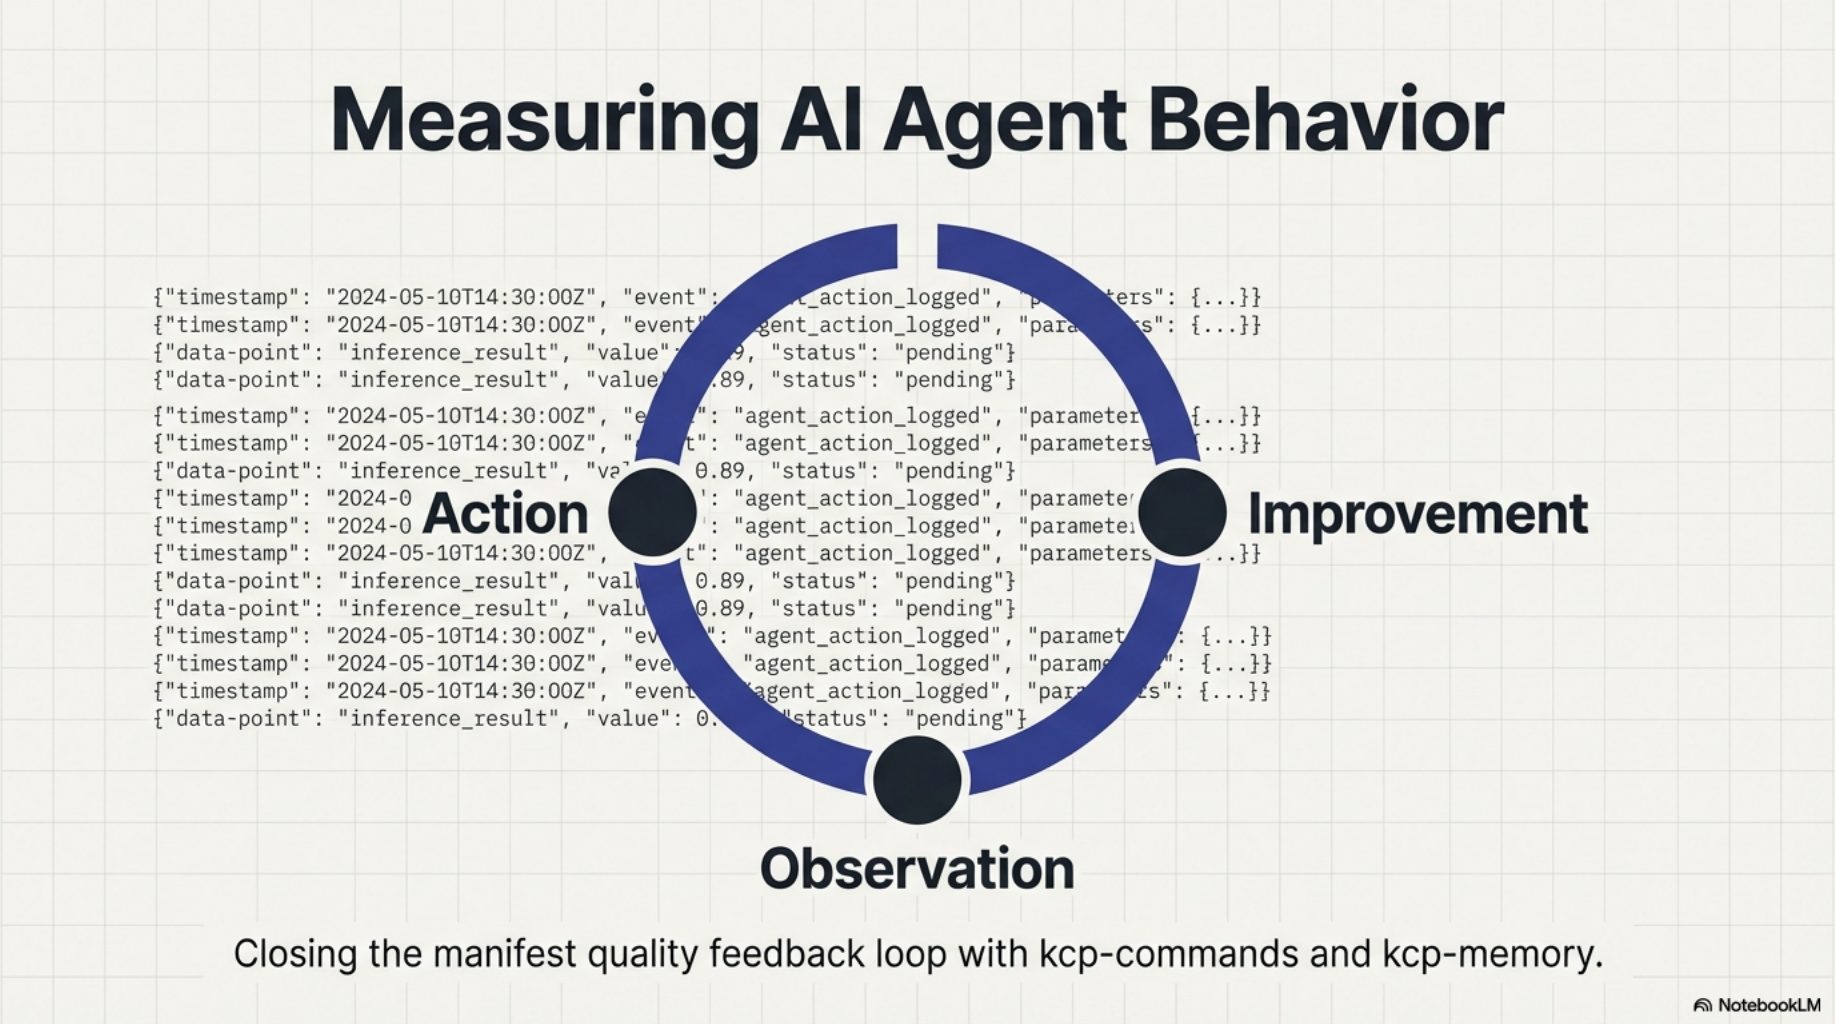
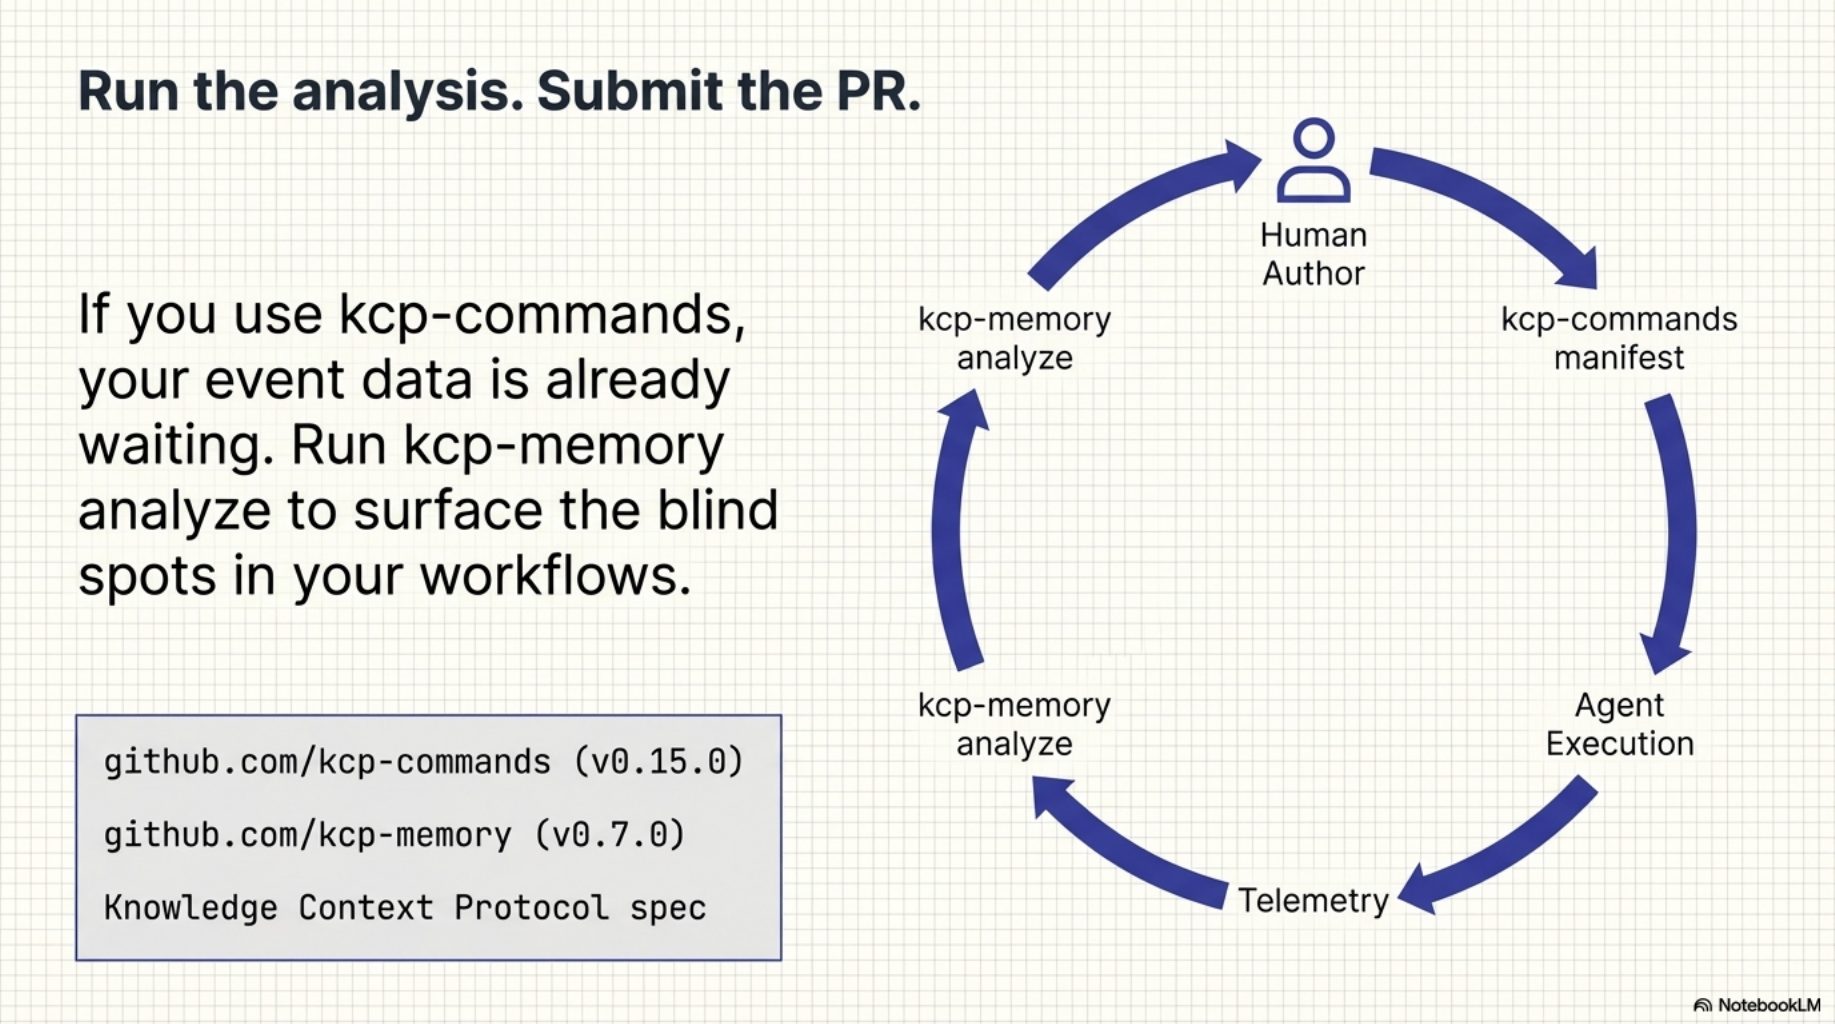
Today we are shipping two small releases that close that gap: kcp-commands v0.15.0 and kcp-memory v0.7.0. Together they create a feedback loop from agent behaviour back to manifest quality -- not by guessing, but by measuring what actually happened.
Every manifest is a blind bet
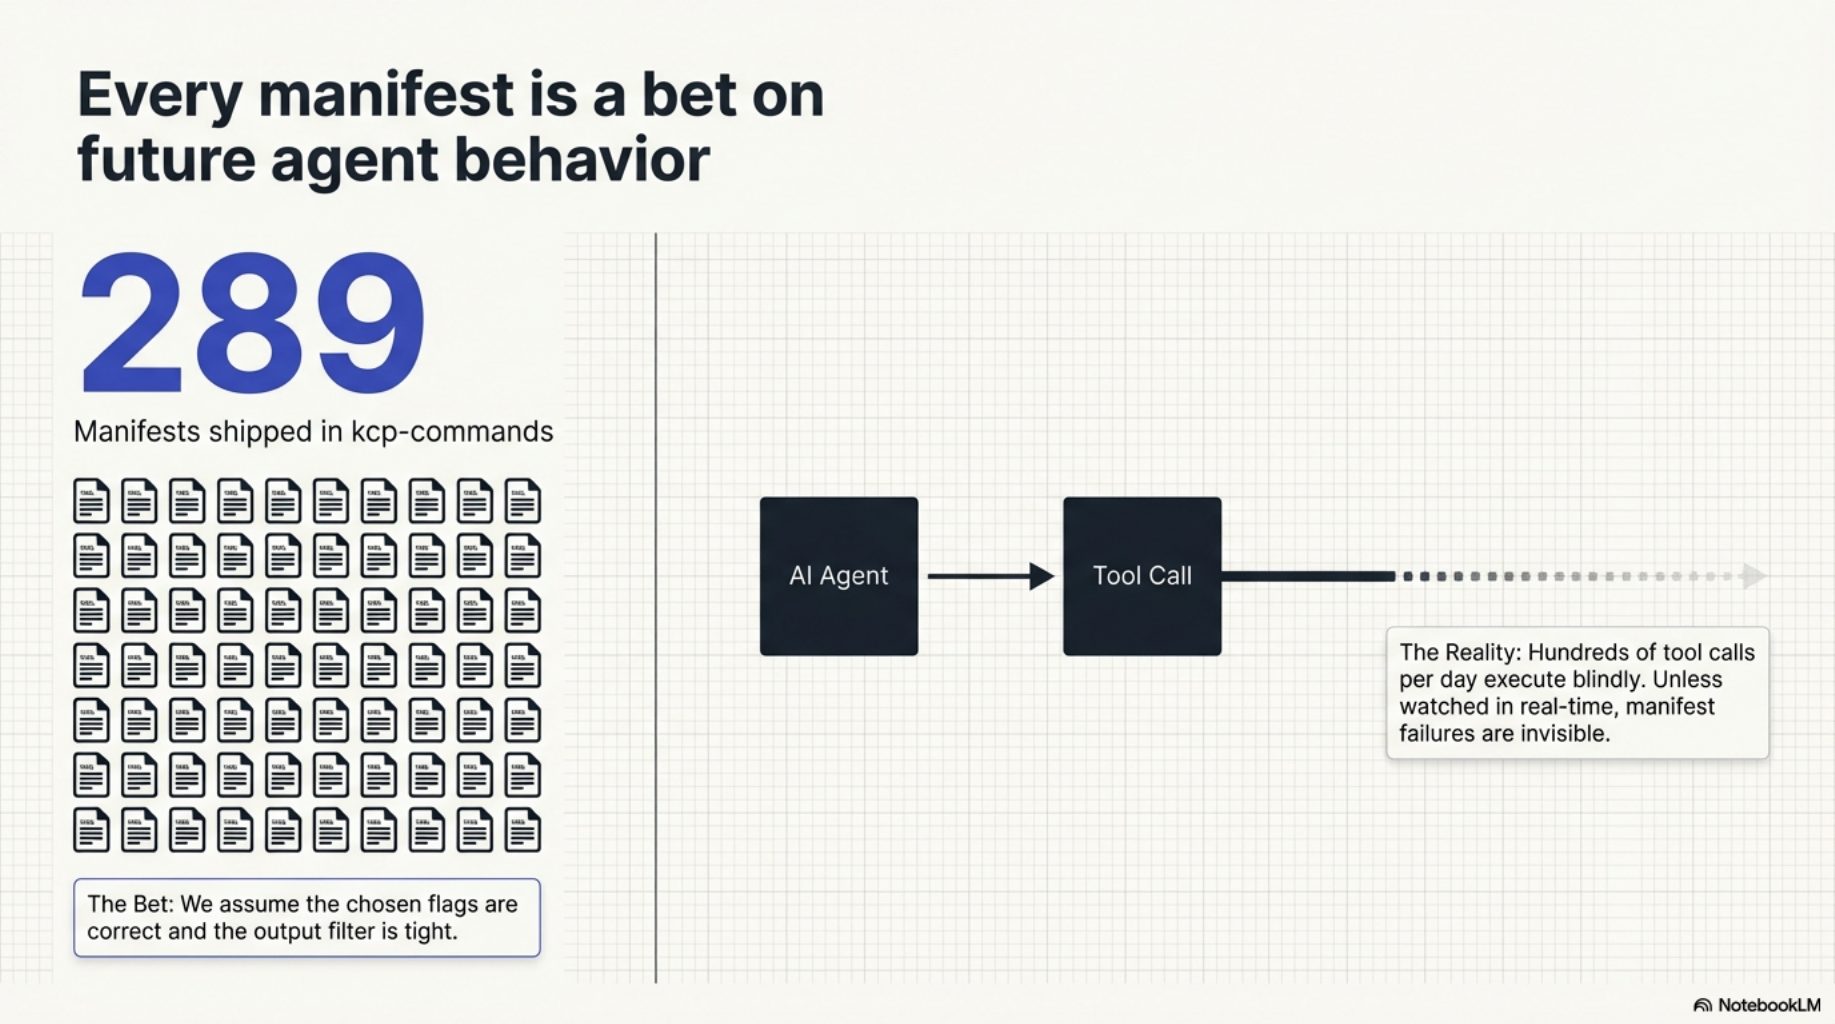
Every manifest in the library was authored by a human making a prediction about what a future agent will need. Those predictions are informed — they come from reading docs, running the commands, watching real sessions — but they are still predictions. There is no mechanism that closes the loop and tells you which ones were right.
The observation that made this possible
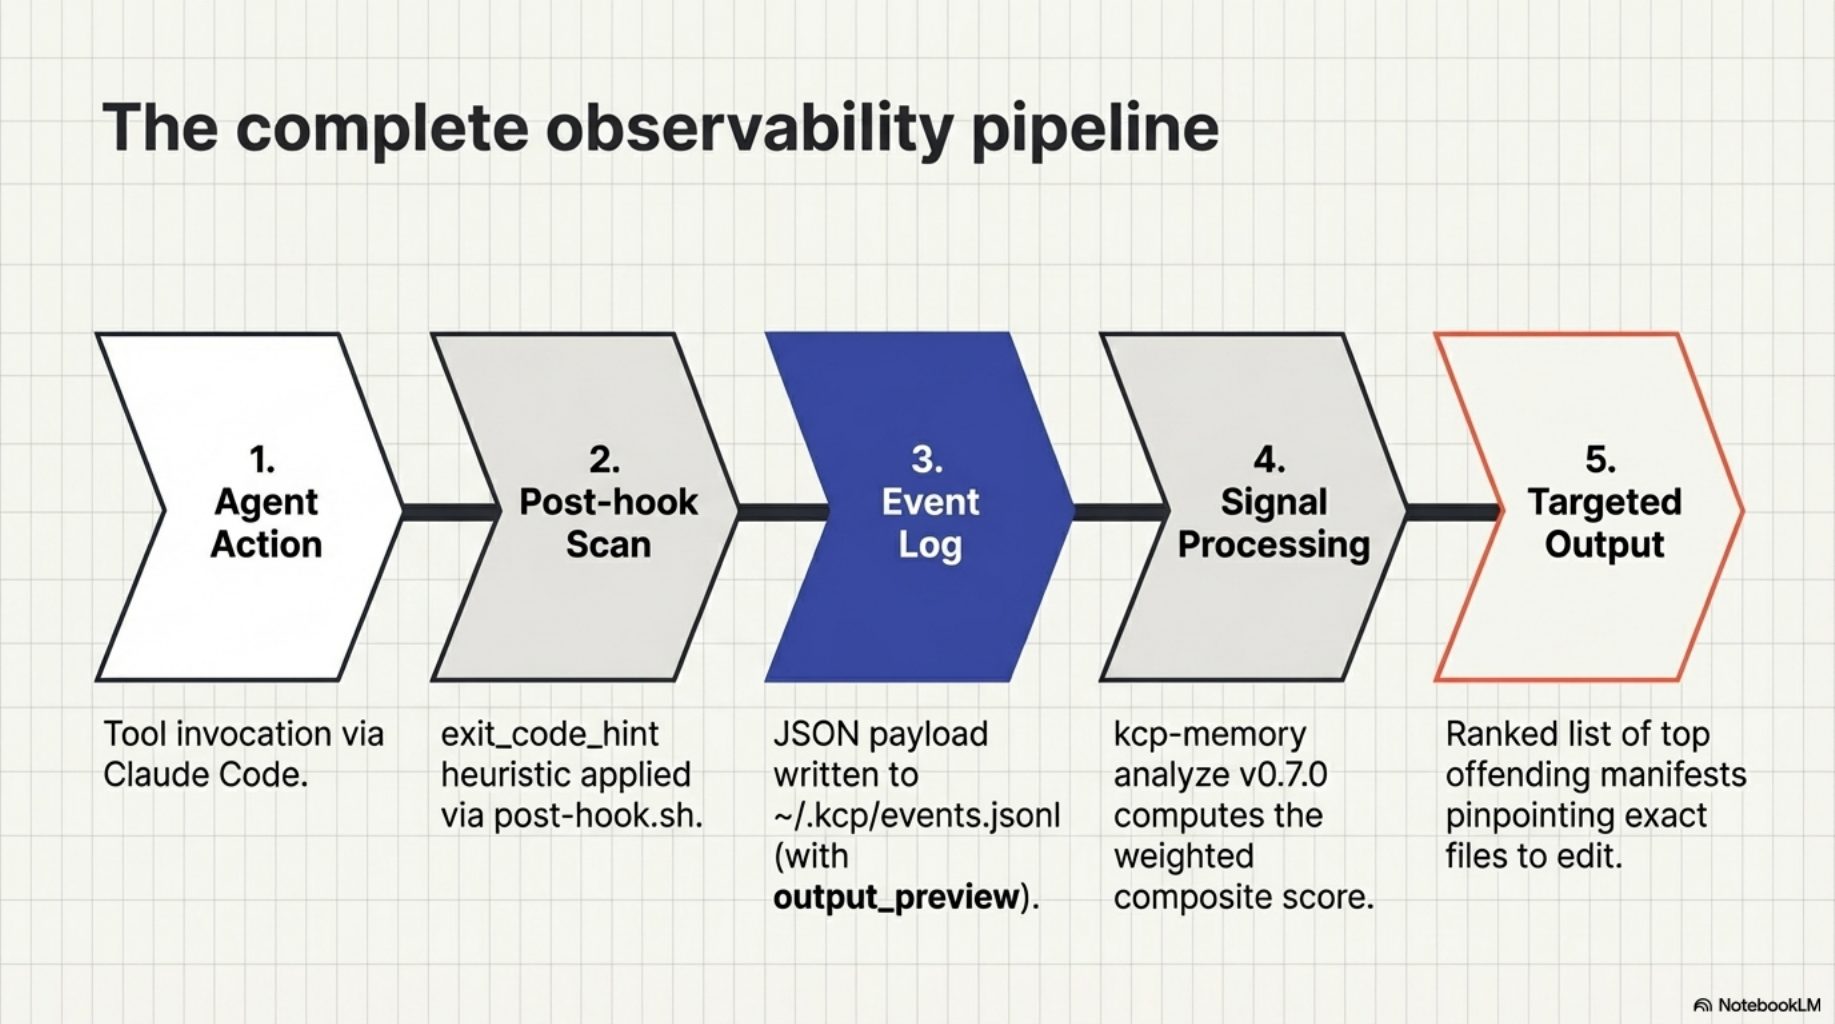
The data was already there. Since kcp-commands v0.9.0, every Bash tool call writes a JSON event to ~/.kcp/events.jsonl. Since kcp-memory v0.6.0, each event captures the first 200 characters of tool output as output_preview. We had a complete record of what the agent ran, what came back, and whether kcp-commands had a manifest for it.
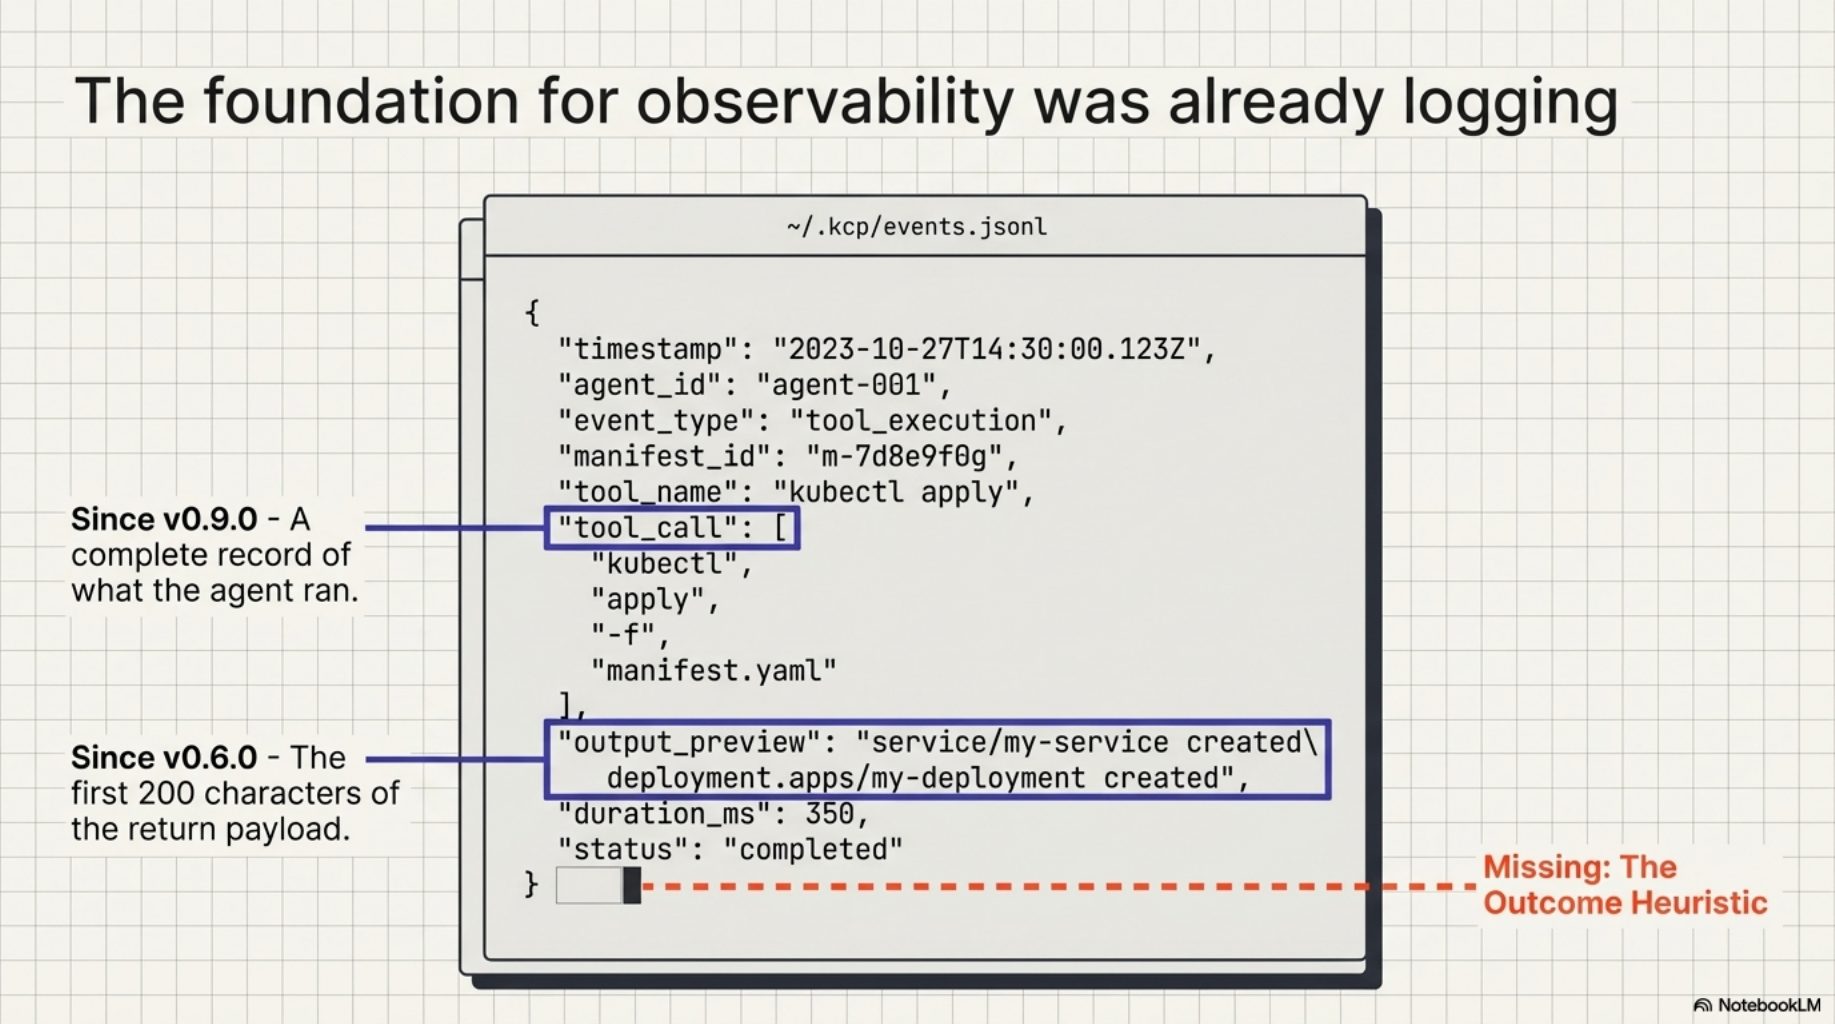
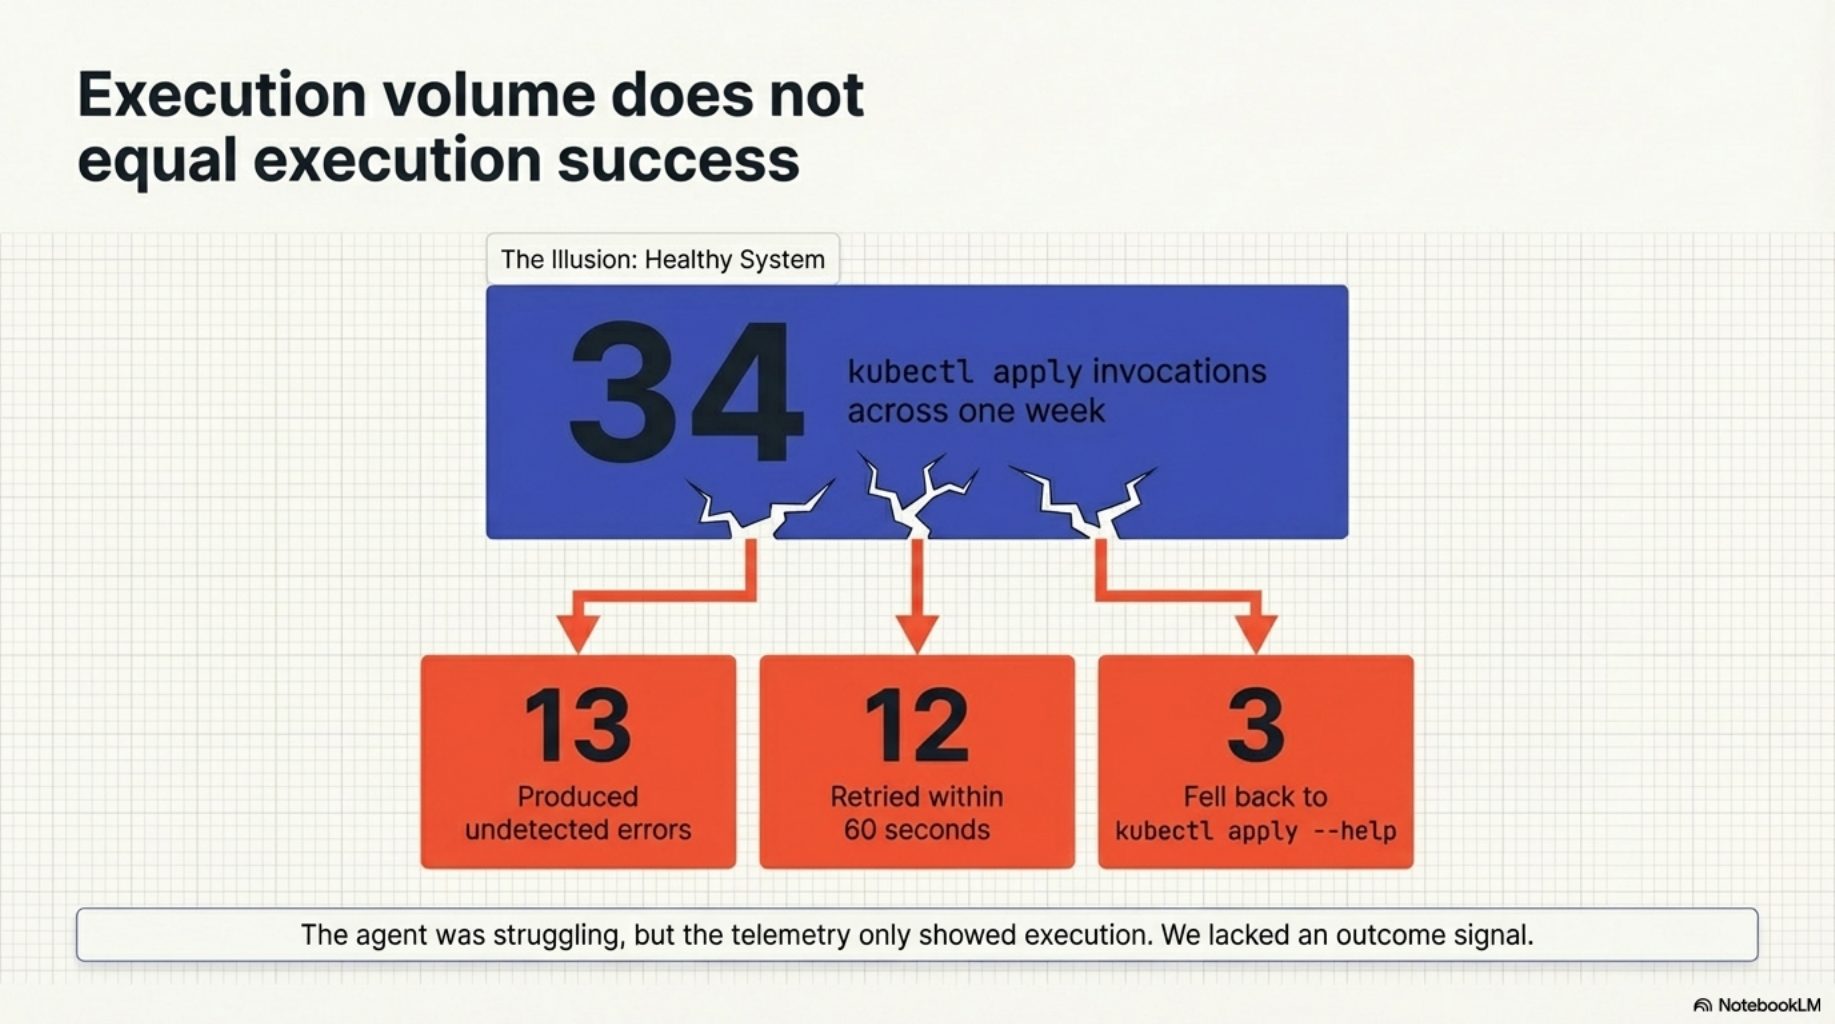
What we were missing was the outcome signal. We could see that kubectl apply was invoked 34 times across a week. We could not see that 13 of those invocations produced errors, or that the agent retried 12 of them within a minute, or that it fell back to kubectl apply --help three times despite receiving the manifest's context block. Those patterns contain the information we need to distinguish a well-authored manifest from a misleading one.
exit_code_hint: the missing signal
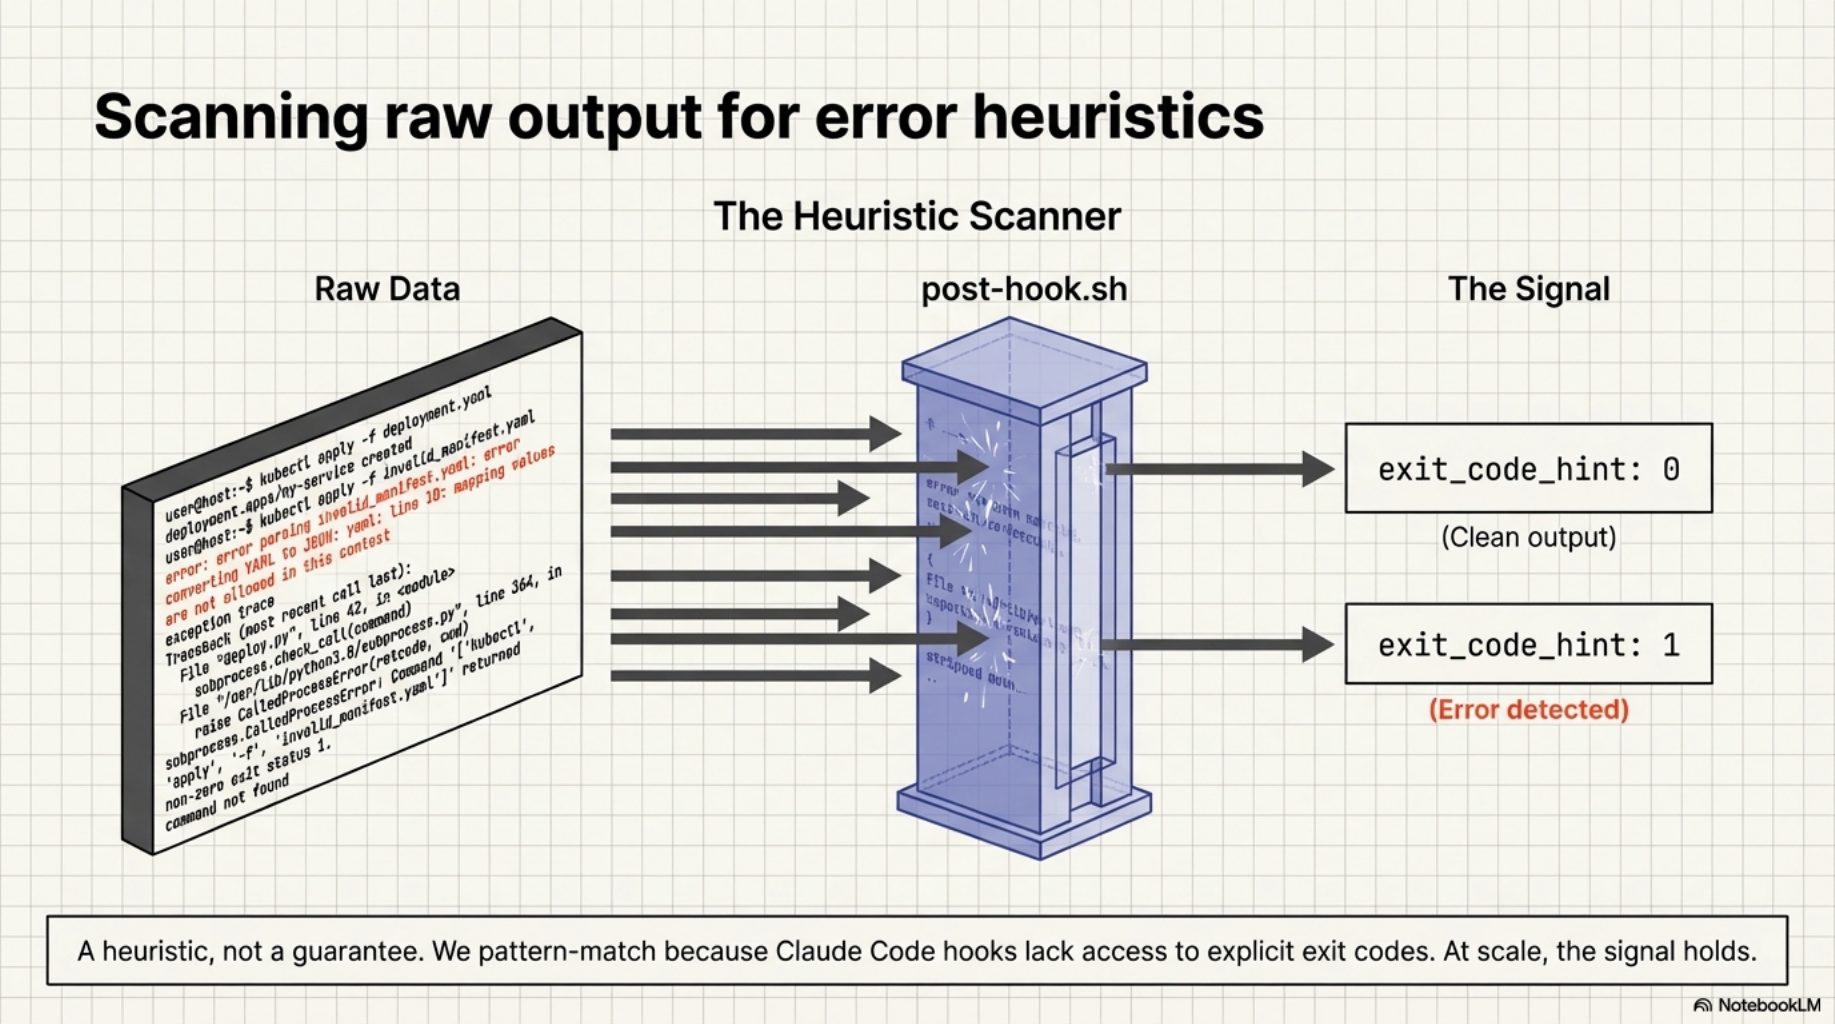
kcp-commands v0.15.0 adds one field to the Phase C event. The post-hook.sh PostToolUse hook now scans tool output for error signals before writing the event:
{"ts":"2026-03-24T10:32:01Z","session_id":"ad732c58","project_dir":"/src/myproject",
 "tool":"Bash","command":"kubectl apply -f deploy.yaml","manifest_key":"kubectl-apply",
 "exit_code_hint":0}
exit_code_hint: 0 means the output looked clean. exit_code_hint: 1 means error signals were detected -- exception traces, "command not found", non-zero exit patterns, tracebacks. It is a heuristic, not a guarantee. Claude Code hooks do not have access to the actual exit code, so we pattern-match on the output. But at the scale of hundreds of tool calls per session, the signal is strong enough to be useful.
The three signals kcp-memory analyze uses
kcp-memory v0.7.0 adds an analyze command that reads the indexed event log and computes three signals per manifest key.
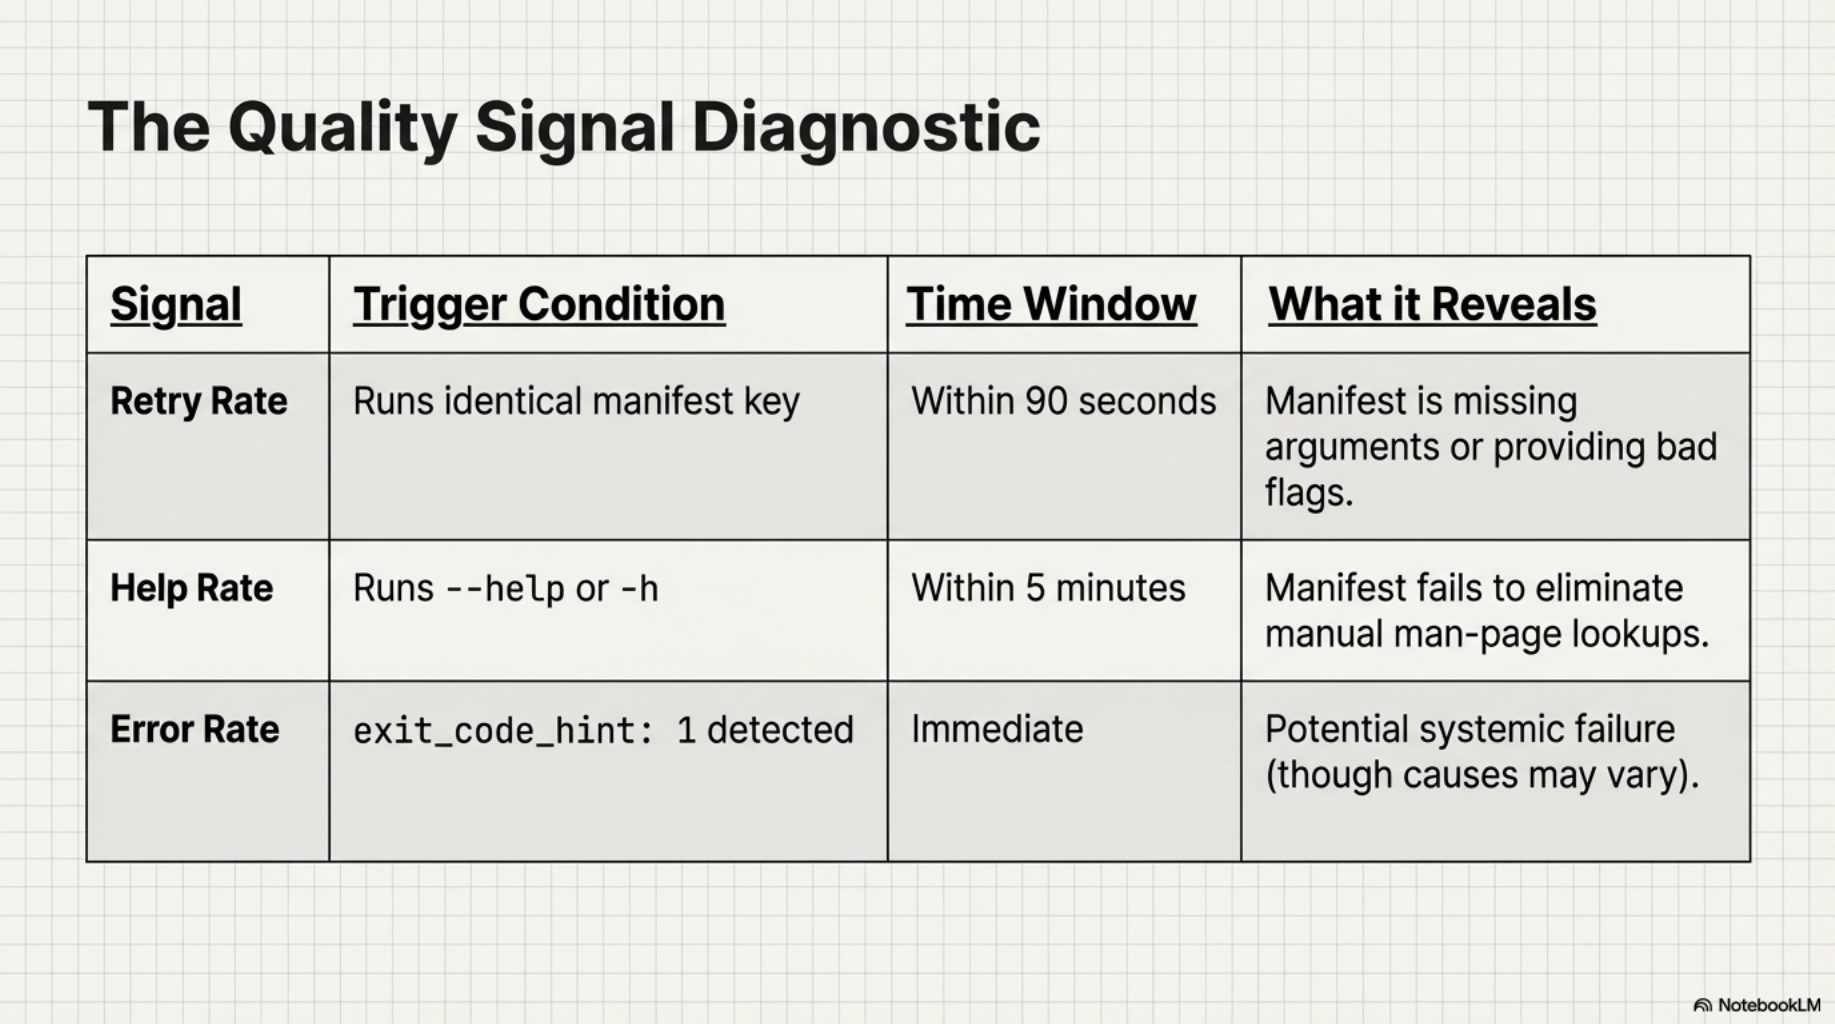
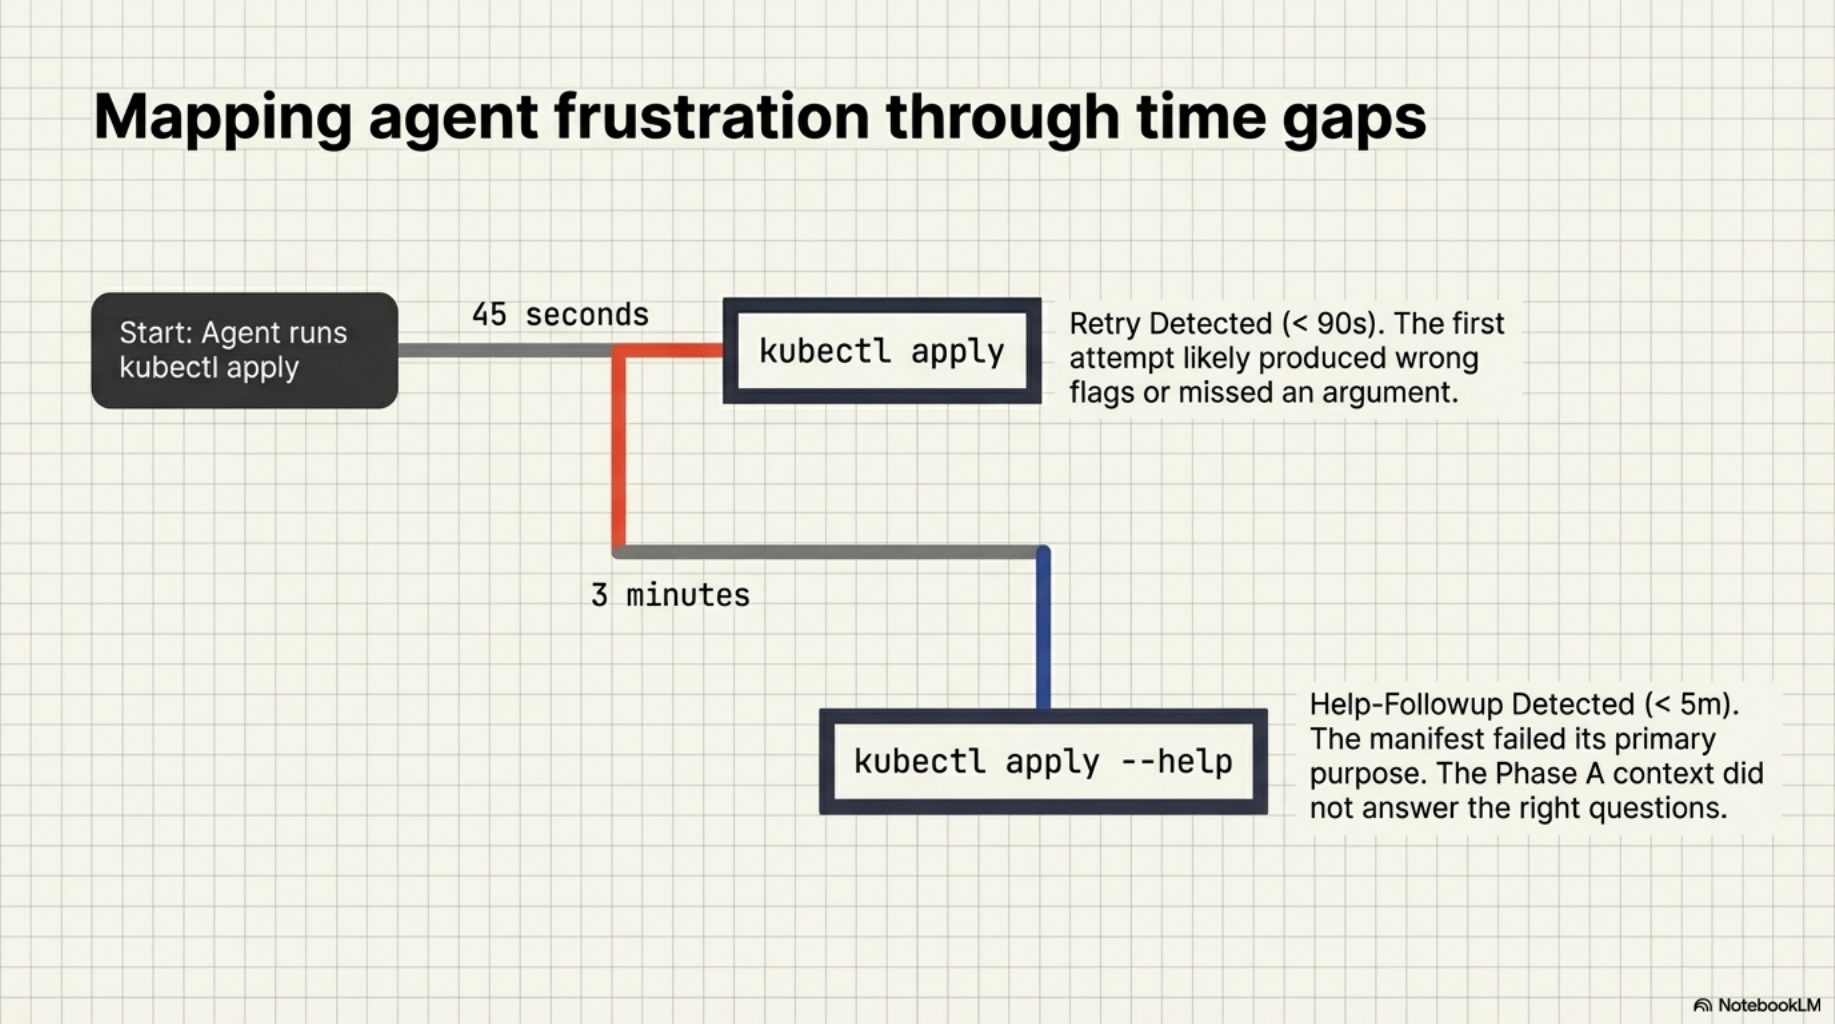
Retry rate -- the same manifest key invoked twice within 90 seconds in the same session. When the agent immediately re-runs a command after getting the manifest's context, the first attempt likely produced the wrong flags or missed a required argument. A high retry rate is the clearest signal a manifest is not pulling its weight.
Help-followup rate -- the agent ran --help or -h within 5 minutes of a manifested invocation. This is the manifest failing its primary purpose: eliminating help lookups. If the agent still needs to check the man page after receiving Phase A context, the manifest did not answer the right questions.
Error rate -- the fraction of invocations where exit_code_hint: 1 was set. Not all errors are manifest problems -- sometimes the command really did fail for reasons unrelated to flag selection. But a consistently high error rate on a specific manifest key is worth investigating.
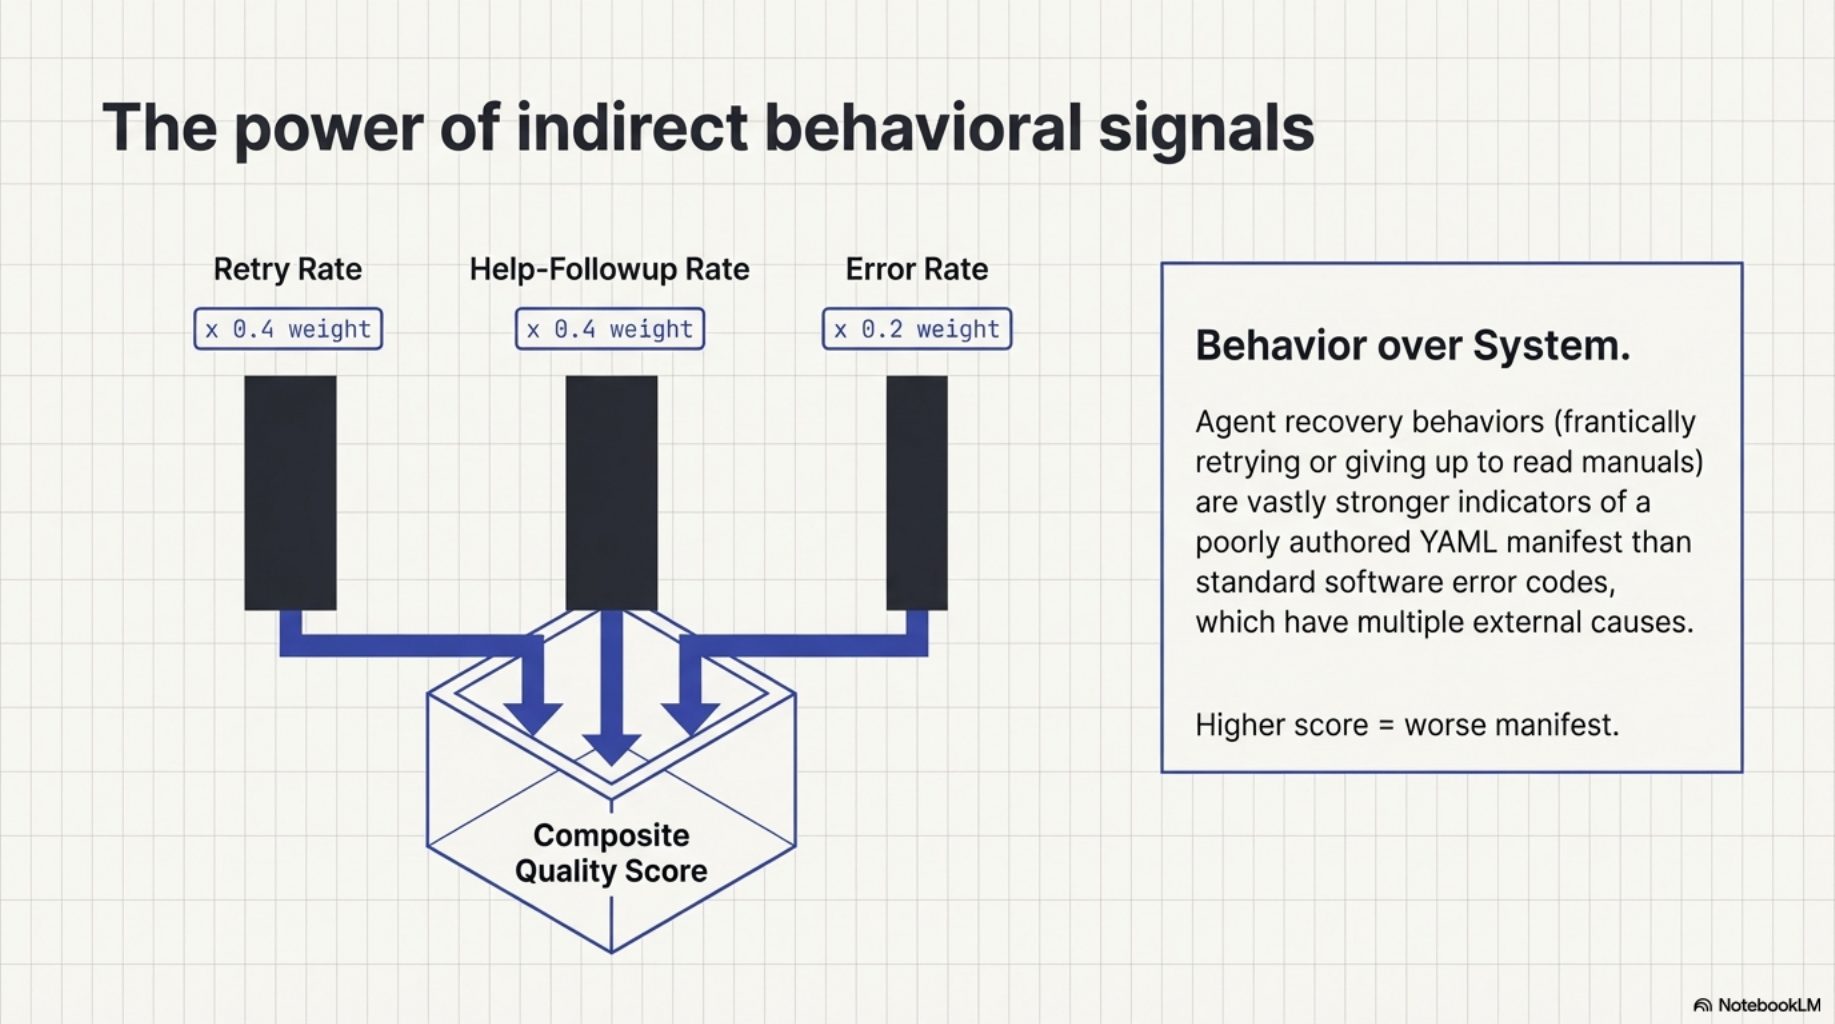
The composite quality score weights these signals: retry_rate * 0.4 + help_followup_rate * 0.4 + error_rate * 0.2. Higher is worse. The weighting reflects a judgment: retries and help lookups are stronger evidence of manifest inadequacy than errors, which have many possible causes.
What the output looks like
$ kcp-memory analyze --top 10 --since 30

[kcp-memory] manifest quality analysis -- 47 manifests, 1,234 total calls

  MANIFEST KEY         CALLS   RETRIES  HELP-FOLLOWUP  ERRORS   SCORE
  -----------------------------------------------------------------------
  kubectl-apply          34      38%         12%         22%     0.31  <- needs attention
  terraform              28      29%         18%          7%     0.24
  docker-compose         19      21%          5%         11%     0.15
  mvn                    87       8%          2%          3%     0.05  ok
  git-log               143       2%          0%          1%     0.01  ok

  Top 3 needing attention:
    kubectl-apply  -- high retry rate (38%) + error rate (22%)
    terraform      -- high retry + help-followup
    docker-compose -- moderate retry rate

  Tip: improve manifests at ~/.kcp/commands/<key>.yaml or submit a PR.
The numbers in that example are illustrative, but the format is real. The table sorts by composite score, flags the top offenders, and points you at the file to edit. No ambiguity about what to do next.
The HyperAgents parallel
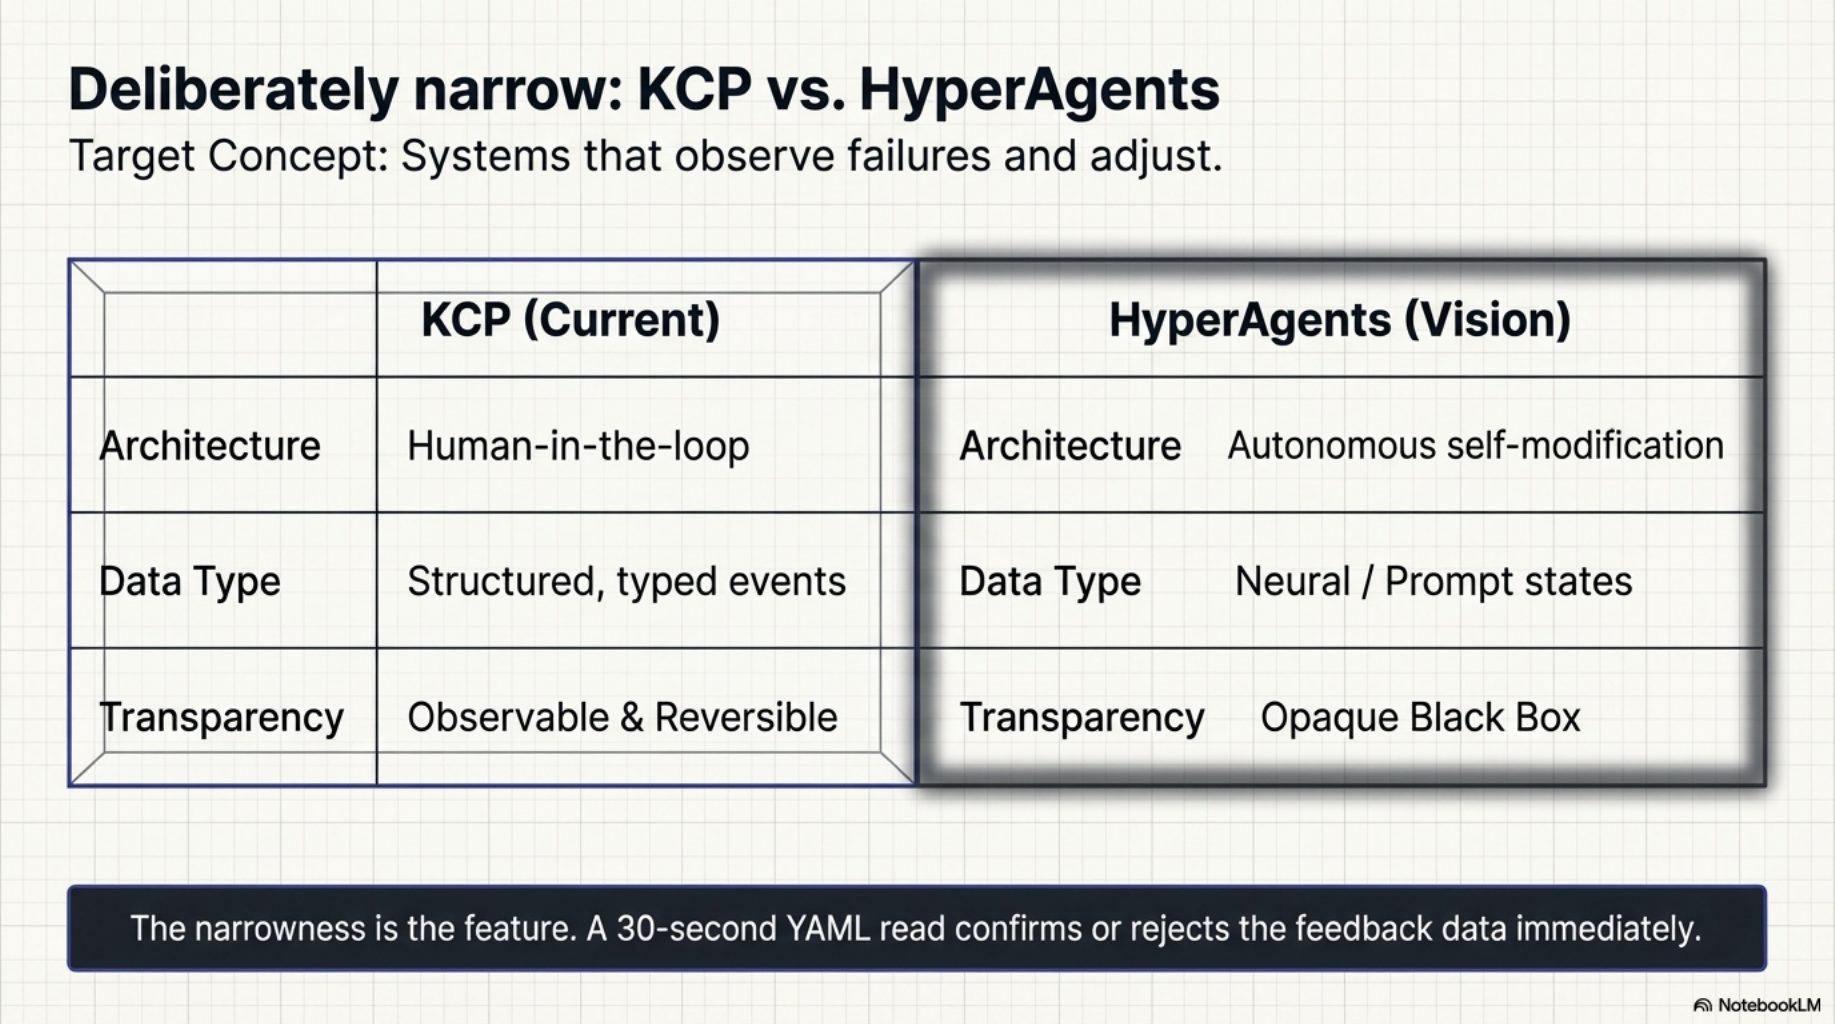
The idea of systems that observe their own failures and adjust has a name in the research literature. The HyperAgents paper describes architectures where agents monitor execution outcomes and feed them back into planning. What we built is deliberately narrower than that vision: structured, typed data (tool calls, exit codes, retry patterns), a concrete improvement target (a YAML manifest file), and a human in the loop at the improvement step. Not autonomous self-modification -- observable, auditable, reversible.
The narrowness is the point. A manifest is small enough to read in 30 seconds and understand completely. The feedback data is concrete enough to confirm or reject. There is no black box between the observation and the improvement.
What comes next
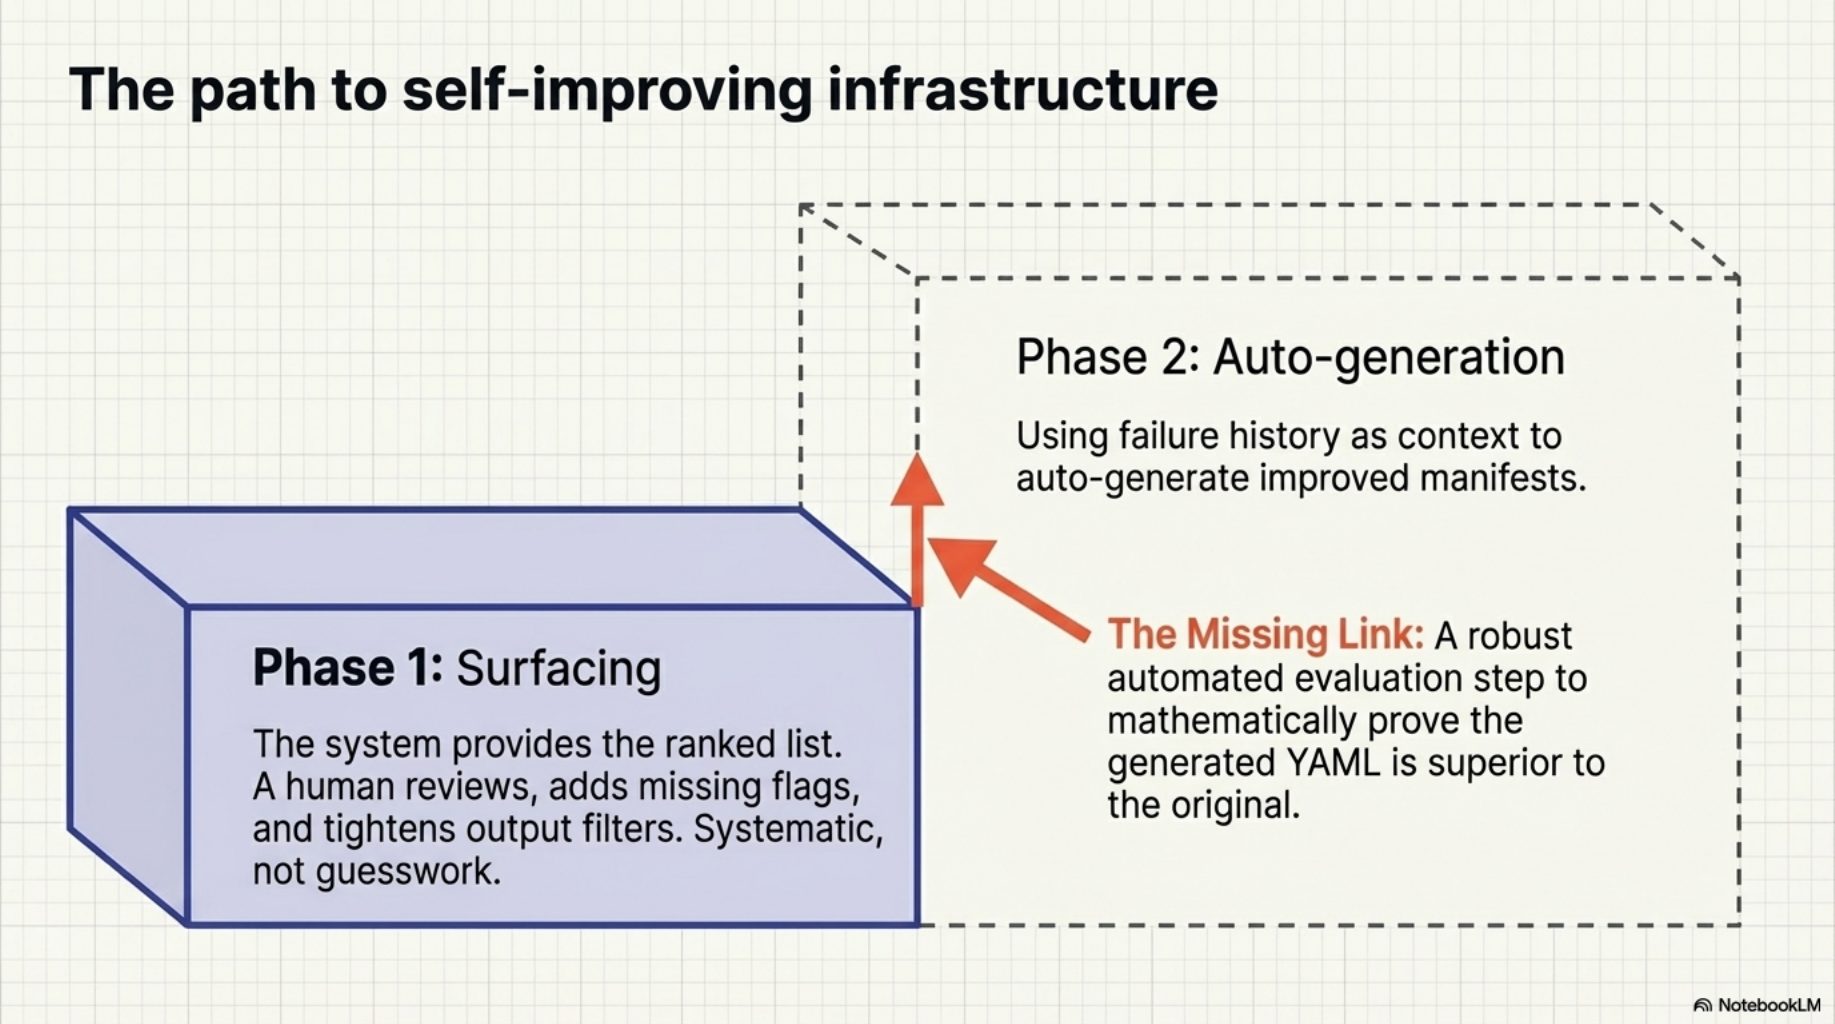
Phase 1 is surfacing. A human reviews the ranked list and improves the flagged manifests -- adds a missing flag, tightens the output filter, adjusts the preferred invocations. Phase 2 -- auto-generating improved manifests using the failure history as context -- is the natural next step. The raw material is already there: the flagged manifest, the commands that failed, the outputs that triggered exit_code_hint: 1. What is missing is the evaluation step to confirm that a generated improvement is actually better than what it replaces.
That is a harder problem. For now, the ranked list is enough to make the improvement process systematic rather than guesswork.
Try it
curl -fsSL https://raw.githubusercontent.com/Cantara/kcp-commands/main/bin/install.sh | bash -s -- --java
curl -fsSL https://raw.githubusercontent.com/Cantara/kcp-memory/main/bin/install.sh | bash

kcp-memory analyze
If you have been using kcp-commands for a while, you already have the event data. kcp-memory analyze will read it and show you which of your manifests are working and which ones need attention. If you find improvements, submit a PR -- 291 manifests is a lot of surface area, and the data now tells us exactly where to look.
This is one part of the story. The full arc -- suppression list, version tracking, subagent memory, analysis as an MCP tool, and auto-update -- is in the companion post: From Instrumentation to Infrastructure.
Series: Knowledge Context Protocol
← KCP v0.10: Pre-Invocation Discovery · Part 21 of 24 · From Instrumentation to Infrastructure →